Question 1205786: Brian is studying for his final exams in Chemistry and Algebra. He knows he has less than 22 hours to study, and it will take him at least three times longer to study for Algebra than Chemistry.
Graph the system on your own graph paper with Chemistry as the independent variable and Algebra as the dependent variable. Then, decide which of the four graphs below shows the correct lines (dotted/solid), and then choose the letter for the region on that graph that should be shaded for the solution. If no regions should be shaded, choose No Solution.
A B C D E F G H I J K L M N O P No Solution
Can he spend 14 hours on Chemistry and 9 hours on Algebra?
Can he spend 15 hours on Chemistry and 9 hours on Algebra?
Found 4 solutions by josgarithmetic, greenestamps, math_tutor2020, Theo:
Answer by josgarithmetic(39616)   (Show Source): (Show Source):
Answer by greenestamps(13198)  (Show Source): (Show Source):
You can put this solution on YOUR website!
(1) Obviously we can't help you with choosing the right graph, since you haven't shown them in your post.
(2) The statement of a math problem should NEVER use the phrase "three times longer than", because nearly everyone interprets that to mean three times as long as, which is not correct. Three times longer than x is x, plus 3 times x, or x+3x = 4x -- i.e., three times longer than is four times as long as.
(3) The two specific questions that are asked are answered trivially, since in both cases the time spent studying for algebra is LESS than the time spent studying for chemistry.
Answer by math_tutor2020(3816) (Show Source):
Answer by Theo(13342)  (Show Source): (Show Source):
You can put this solution on YOUR website! using the desmos.com calculator, you would graph the opposite of the constraint inequalities.
the area that is not shaded is the region of feasibility.
if the inequality is < or >, then any point on the line is not feasible.
if the inequality is <= or >=, then any point on the line is feasible.
all points in the area that is not shaded are feasible.
in these inequalities, the dependent variable is y and the independent variable is x.
you select the value of x and the value of y is then determined from the equation.
your inequalities are:
x < 22 - x
y <= x/3
x >= 0
y >= 0
x is the number of hours for algebra.
y is the number of hours for chemistry.
the first one says that your total number of hours available is less than 22.
the equation starts off as x + y < 22 and you solve for y to get y < 22 - x.
you would draw that line as dashed, since the value cannot be 22.
the second one says that the hours to study algebra are at least as 3 times the hours to study chemistry.
you start with x >= 3y
you solve for y to get y <= x/3
the third and fourth simply state that the number of hours can't be negative.
you are solving for y because you want y to be the dependent variable.
this means you pick the number of hours and the equation tells you whether those number of hours are valid, given the constraints.
the graph looks like this.
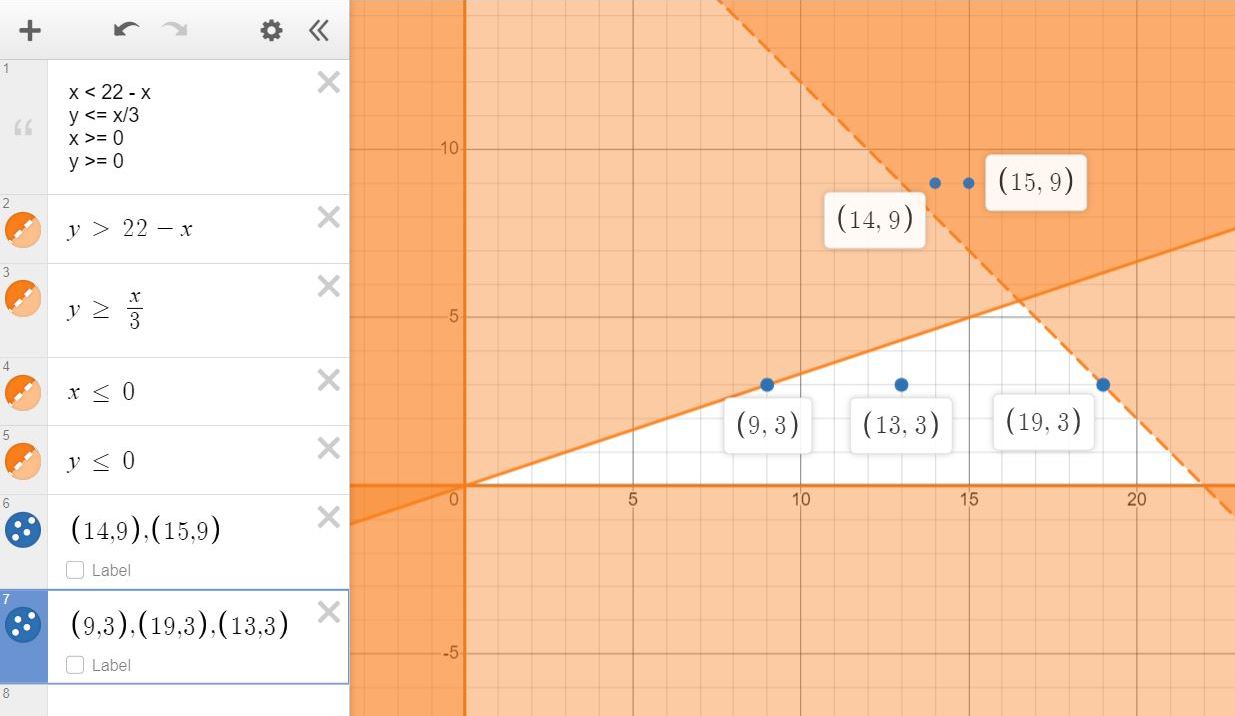
the points (14,9) and (15,9) are both not valid because they are outside the region of feasibility.
applying the inequalities to these points gets you:
(14,9) inequality of x + y = 23 which is not less than 22.
(15,9) inequality of x + y = 24 which is also not less than 22.
in addition, y <= x/3 gets you y = 14/3 = 4.67 and 9 is not less than or equal to that.
similarly, y <= x/3 gets you y = 15/3 = 5 and 9 is also not less than or equal to that.
bottom line, the two points fail on both constraints.
(9,3) is valid because the sum is less than 22 and 3 <= 9/3.
(13,3) is valid because the sum is less than 22 and 3 <= 13/3.
(19,3) is not valid because the sum is 22 which is not less than 22.
3 is <= 19/3, so that test is passed.
unfortunately all tests need to be passed for the point to be valid, not just some of them.
when you draw the graph manually, you would shade the region that is not shaded on the desmos.com graph.
in other words, you would graph he inequalities as is and not the reverse of the inequalities.
in desmos, the reverse of the inequalities is graphed because the region of feasibility shows up clearly.
it would not if you tried to graph the inequalities as they are using desmos.
the calculator can be found at https://www.desmos.com/calculator
let me know if you have any questions.
theo
|
|
|