Question 1055415: in a teddy bear factory 130 bears would be sold for $8 each. the company knows that if they charge an extra $1 for each bear, then amount of sales would drop by 4 bears. if the company decides to increase each bear by $x, write an expression for the amount of revenue.
Answer by Theo(13342)   (Show Source): (Show Source):
You can put this solution on YOUR website! 130 bears will be sold for $8 apiece.
revenue with 130 bears is equal to 130 * 8.
for each dollars added to the price of the bears, 4 bears less will be sold.
let x equal the number of dollars added to the base cost of 8 dollars for each bear.
let 4x equal the number of bears subtracted from the base number of 130 for each dollar added to the cost.
the formula for revenue becomes r = (130 - 4x) * (8 + x)
under the assumption that, if the price is dropped x dollars, then 4x more bears will be sold, this formula can be used to find the the total revenue whether you add x dollars to the price or whether you drop x dollars from the price.
for example:
when x = 0, 130 bears are sold at 8 dollars apiece for a total of 8 * 130 = 1040 dollars in revenue.
when x = 1, 126 bears are sold at 9 dollars apiece for a total of 9 * 126 = 1134 dollars.
when x = -1, 134 bears are sold at 7 dollars apiece for a total of 7 * 134 = 938 dollars.
the equation of y = (130 - 4x) * (8 + x) can be graphed.
when graphing, the y replaces the r.
the value of the increase or decrease in the base dollar of 8 is shown on the x-axis.
the value of the revenue is shown on the y-axis.
the coordinate points are generally shown as (x,y).
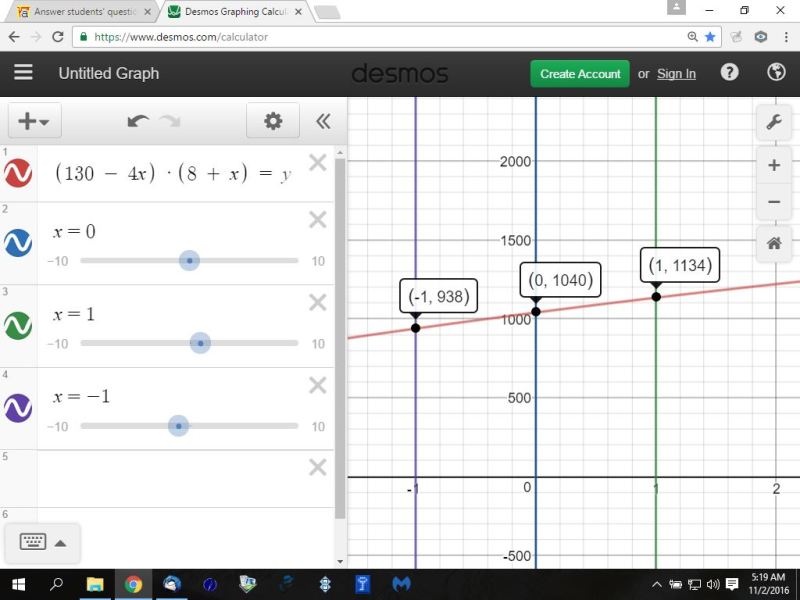
for example, the coordinate point of (0,1040) tells you that when nothing is added to the base price of 8 dollars for each bear, the total revenue is 1040 dollars.
the first graph shows the values of y when x = -1, 0, 1.
this corresponds to the price for each bear being 7, 8, 9.
x represents the change from the base price of 8.
y represents the revenue.
here's that graph.
look below it for the second graph.
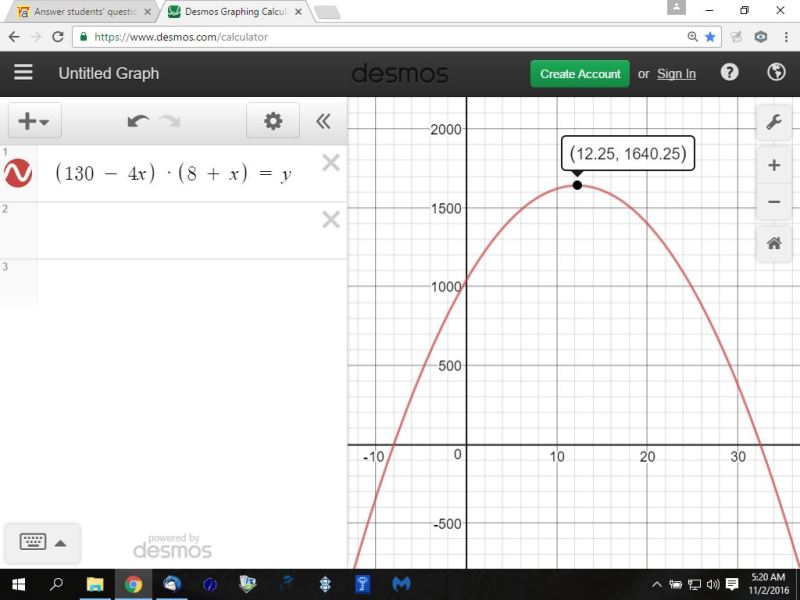
the second graph shows the full graph and the fact that the maximum revenue occurs when x = 12.25.
when x = 12.25, the number of bears sold is (130 - 4) * 12.25 = 81 and the price per bear is (8 + 12.25) = 20.25
the total revenue is 20.25 * 81 = 1640.25.
x = 12.25 represents the change from the base price of 8.
y = 1640.25 represents the revenue generated when the price of the bear was increased from 8 to 20.25.
here's that graph.
|
|
|