Tutors Answer Your Questions about Scatterplots-graphs (FREE)
Question 1203945: All real numbers at least -5 and at most 9
Answer by MathLover1(20849)   (Show Source): (Show Source):
Question 1202524: A cylindrical container closed at both ends has a radius of 7cm and height of 6cm. A) fine the total surface area of the container. B) what is the volume of this container
Answer by josgarithmetic(39616) (Show Source):
You can put this solution on YOUR website! Make a simple figure on paper if it would help. If you do not know the formulas to use, look for them in your book or a reference publication.
The total surface area: 571.77 square centimeters.
Volume: You figure for this one.
Question 1202112: A contractor recorded the amount of money earned for different jobs and the amount of time spent on each job. The data are shown in the scatterplot below. Based on the data, interpolate the amount of money the carpenter would earn from a job that took 5 days to complete.
Answer by ikleyn(52776)  (Show Source): (Show Source):
You can put this solution on YOUR website! .
A contractor recorded the amount of money earned for different jobs and the amount of time spent on each job.
The data are shown in the scatterplot below. Based on the data, interpolate the amount of money the carpenter
would earn from a job that took 5 days to complete.
~~~~~~~~~~~~~~~~~~~~~~~
There is no plot in this post.
Question 1196570: Because it is not practical to weigh bears in the field, researchers sought to develop a model to predict a bear's weight based on its length. Here are the results for a sample (this is the exact same data as the previous question):
Total Length (cm) Weight (kg)
139.0 110
138.0 60
139.0 90
120.5 60
149.0 85
141.0 100
141.0 95
150.0 85
166.0 155
151.5 140
129.5 105
150.0 110
The explanatory variable is .
If the bear length was instead measured in inches (there are 2.54 cm in one inch) and the weight was measured in pounds (there are 2.2 pounds in one kg), then the linear correlation coefficient would .
Found 2 solutions by math_tutor2020, ewatrrr:
Answer by math_tutor2020(3816) (Show Source):
You can put this solution on YOUR website!
I don't know how the tutor @ewatrrr is getting r = 0.284846442 as that isn't correct.
The correct r value is approximately r = 0.703903176239897
which when rounded to four decimal places is roughly r = 0.7039
You can use any correlation coefficient calculator you like to confirm this.
Here is one such online calculator
http://www.alcula.com/calculators/statistics/correlation-coefficient/
Refer to this page to see an example how the r value is calculated
https://www.algebra.com/algebra/homework/word/evaluation/Evaluation_Word_Problems.faq.question.1196643.html
--------------------------------------------------------------------------------------------------------------------------------------
However, @ewatrrr is correct in stating that the r value doesn't change when you scale the data sets consistently across the board.
Consider this example set A = {1,2,3,4}
The mean is 2.5 which is found by adding up the values and dividing by the sample size n = 4
Now multiply each item by 5 to get B = {5,10,15,20} and the mean of this is 12.5; this is a jump of "times 5" since 2.5*5 = 12.5
Therefore, the mean has scaled exactly the same way as the other values.
The standard deviation will also scale up by 5 through more complicated steps.
Apply that type of logic to this current data set and you'll find the mean and standard deviation are scaled the same amount.
If for instance we multiplied everything in the x data set by 5 then the old Zx = (x-xbar)/sigma will turn into the new Zx = (5x - 5*xbar)/(5*sigma), in which the 5's cancel
The 5 isn't that special and you can use any constant you like. The multiplier will cancel out anyway.
The Zx for the original x data set, and the Zx for the scaled x data set, are the same.
The Zx value doesn't change as long as we apply the same multiplier to each x.
Similar reasoning shows Zy doesn't change either. You don't have to use the same multiplier as you did with the x data set.
Hence the value
r = Sum(ZxZy)/(n-1)
will remain the same.
This fact is mentioned in the article here
https://en.wikipedia.org/wiki/Pearson_correlation_coefficient
Quote: "A key mathematical property of the Pearson correlation coefficient is that it is invariant under separate changes in location and scale in the two variables. That is, we may transform X to a + bX and transform Y to c + dY, where a, b, c, and d are constants with b, d > 0, without changing the correlation coefficient."
Also, this article mentions it as well
https://online.stat.psu.edu/stat509/lesson/18/18.1
scroll down to the portion that reads "The Pearson correlation coefficient is invariant to location and scale transformations"
Answer by ewatrrr(24785)  (Show Source): (Show Source):
You can put this solution on YOUR website!
Hi
LENTH VS WEIGHT OF BEAR
First listed in cm & kg, then as listed in inches & pounds
139	110		353.06	242
138	60		350.52	132
139	90		353.06	198
120.5	60		306.07	132
149	85		378.46	187
141	100		358.14	220
141	95		358.14	209
150	858**Note typo		381	1887.6
166	155		421.64	341
151.5	140		384.81	308
129.5	105		328.93	231
150	110		381	242

Using Excel Function CORREL FOR BOTH LISTINGS to find
the linear correlation coefficient
Yes. Entered correctly in Excel...
r = 0.703903			r= 0.703903
As one would expect, this demonstrates that changing the units
 has NO bearing on r.

Wish You the Best in your Studies.
Question 1196569: A researcher is analyzing the relationship between club-head speed of a golf club (measured in miles per hour, mph) and the distance (in yards) that the ball will travel. The researcher records these values for five shots made by the same golfer, with the same club on a single day with no wind. Note: values in red may change on subsequent attempts.
Club-head speed (mph) 105.2 102.2 104.1 101.6 105.5
Distance (yards) 251.3 264.1 274.2 266.5 277.9
Calculate the linear correlation coefficient. Round your answer to three digits after the decimal.
Answer by ewatrrr(24785) (Show Source):
You can put this solution on YOUR website!
Hi

analyzing the relationship between club-head speed of a golf club (measured in miles per hour, mph) and the distance (in yards) that the ball will travel.
Calculate the linear correlation coefficient

105.2	251.3
102.2	264.1
104.1	274.2
101.6	266.5
105.5	277.9
Using Excel FUNCTION
=CORREL(A1:A5, B1:B5) for example

r = .060 (Rounded to three digits after the decimal)
Positive, however weak correlation between club speed and distance

Wish You the Best in your Studies.
Question 1191870: Your class is given a real-world scenario of a linear function in which the rate of change is - 3 and the initial value is - 10. You wrote the equation y=−3x+(−10) to represent the function. Your classmate wrote y=−3x−10 . Who is correct? Justify your response.
Found 2 solutions by josgarithmetic, Theo:
Answer by josgarithmetic(39616) (Show Source):
Answer by Theo(13342)  (Show Source): (Show Source):
You can put this solution on YOUR website! y = -3 + (-10) is equal to y = -3 - 10
they're both correct.
here's a reference on the rules for adding, subtracting, multiplying, dividing positive and negative numbers.
https://www.cuemath.com/questions/rules-for-adding-subtracting-multiplying-and-dividing-positive-and-negative-numbers/
while they are both correct, i think y = -3 - 10 might be more correct because it has been simplified further, but that's only if the answer was required to be simplified as far as it could.
since it was not specified that the answer need to be in simplest terms, they are both equally correct.
they will both give you the exact same answer.
here's a graph to show you that they are equivalent.
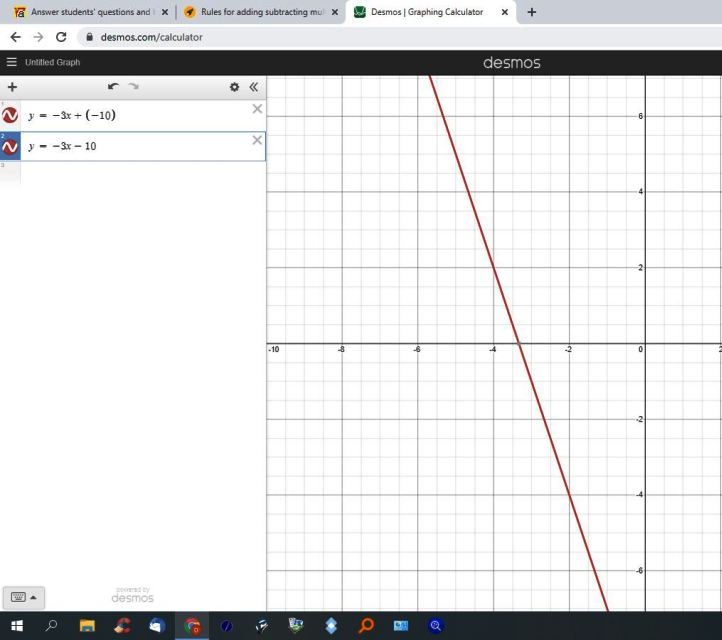
both equations draw the same line on the graph.
Question 1183616: In one experiment, a number of cars with different characteristics are run on a test track at a speed of between 70 and 80 kilometers per hour. A number of properties are measured and the average consumption of fuel is registered.
The variables included in the analysis are
- The car's average consumption in liters / mile
- Weight of the car in kilograms (Weight)
- The car's average speed during the test in km / h (Average speed)
- Whether the car was front-wheel drive, rear-wheel drive or four-wheel drive (Front-wheel drive, Rear-wheel drive, Four-wheel drive)
The information is then entered into Excel and a regression analysis is performed, with the following results:
Coffecients:
Constant: 0,3067
Weight: 0,0001
Average speed:0,0023 with t: 1,1494
Rear wheel drive:0,0151
Four-wheel drive:0,0586
ANOVA
F: 10,4011
p -vaule for F: 4,77726E-08 = 0,0000000477726
a)Interpret the equation and it's components in words
b) Interpret the completed F-test. Also set out the current hypotheses and describe what they mean.
c) Interpret the average t-test performed for Average Speed. Also set out the current hypotheses and describe what they mean.
Answer by ikleyn(52776) (Show Source):
You can put this solution on YOUR website! .
The longer a post is, the lesser a chance that somebody will read it.
It is the LAW on how the contemporary people take reading.
Therefore, normal Math problem is 3 - 4, maximum 5 lines of standard text.
Everything longer is not a Math problem.
Question 1183699: In a survey of energy consumption per month among residential villas, the connection between was examined
- the actual consumption measured as kilowatt hours per month (kWh / month)
- the outdoor temperature in the current month
- what year the villa was built
- how many people lived in the house
- if the house was additionally insulated in the ceiling ("half" additional insulation), in the roof and walls ("full" additional insulation) or not at all
Coefficients
Constant: 485,59
outdoor temperature: 2,478
Year of construction: 0,0406
Number of people in the household: -3,267
Additional insulation half: -108,435
Additional insulation half:-341,380
1. What is the estimated regression equation? Write down and explain.
2. Interpret the coefficients with words.
Answer by ikleyn(52776) (Show Source):
You can put this solution on YOUR website! .
In your post, this variable "Additional insulation half" is copied twice with different numerical values
    Additional insulation half: -108,435
    Additional insulation half: -341,380
I do not think that it is correct.
Double check with your source.
If you decide to re-post it after correction, then please do not post it to me personally:
re-post it to the forum, as you make it regularly.
Question 1183598: Regression analysis
A researcher wants to investigate the relationship between schooling (years of education) and wages (1000 USD). The aim is to find out the “return to education”. To be able to investigate this, the researcher collects data among workers and decides to conduct a regression analysis. Additional independent variables are years of working experience (“Experience”), years of working experience-squared (“Experience-sq”), and a dummy variable for the race (if the worker is “Hispanic” then the dummy takes value 1 otherwise 0). She obtains the following regression results.
Coefficients
Constant:-0,532
Schooling: 0,057
Race dummy: -0,032
Experience: 0,066
Experience-squared: -0,002
1. What is the estimated regression equation? Write down and explain.
2. Interpret the coefficients with words.
Thank you very much for your time i really appreciate it!
Answer by robertb(5830)  (Show Source): (Show Source):
You can put this solution on YOUR website! 1.  is your multiple regression equation. is your multiple regression equation.
2. This means that, every additional year of schooling increases wage by $57, and every additional year of experience increases wage by $66.
However, any unit increase in experience-squared brings a decrease of $2, and in general Hispanics earn $32 less than non-Hispanics.
The constant coefficient provides a baseline wage for an entry level job for a new graduate, i.e., without any years of experience and initially
graduate has no wages, and depending only on the number of years of education and Hispanicity. This means that, non-Hispanics will have to study
0.532/0.057 = 9.33 years to earn baseline wages, while Hispanics will have to study on average 0.564/0.057 = 9.9 years to reach same baseline wages.
Question 1178134: Developing high quality software depends on meeting professional software standards and criteria. A company called DACCI has discovered that a former employee has been using highly valuable software that was developed by other employees of DACCI. Discuss what legal and/or ethical issues are relevant in the above scenario.
Found 2 solutions by ikleyn, math_helper:
Answer by ikleyn(52776) (Show Source):
Answer by math_helper(2461)  (Show Source): (Show Source):
Question 1167166: Draw a function whose domain is [-3,7] and range is [0,6]
Answer by solver91311(24713)  (Show Source): (Show Source):
Question 1157038: Assume that the weight loss for the first month of a diet program varies between 6 pounds and 12 pounds, and is spread evenly over the range of possibilities, so that there is a uniform distribution. Find the probability that the given range of pounds lost is between 8 pounds and 11 pounds.
Answer by ikleyn(52776) (Show Source):
Question 1149855: I need help on a two part problem. The table shows the number y of pineapple plants in a garden x years since 2004. The table´s ordered pairs are (2,4) (3,7) (4,9) (7,15) (8,16) (9,19). Part one says Write an equation that models the approximate number of pineapple plants as a function of the number of years since 2004. Part two says Interpret the slope and y-intercept of the line of fit.
Answer by Theo(13342) (Show Source):
You can put this solution on YOUR website! you can do the line of fit manually or you can use a linear regression formula.
using an online linear regression graphing calculator, i get:
Regression line equation: y = 2.0240963855422 * x + 0.53413654618474
the results from the use of this calculator look like this:
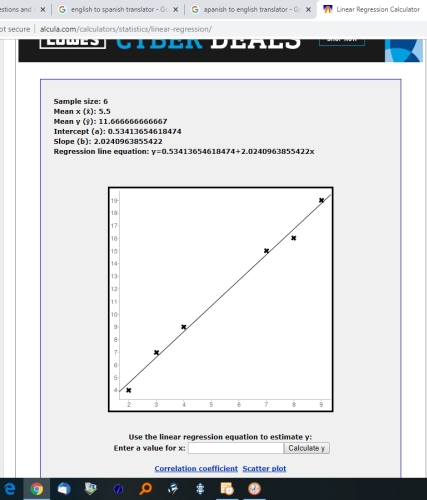
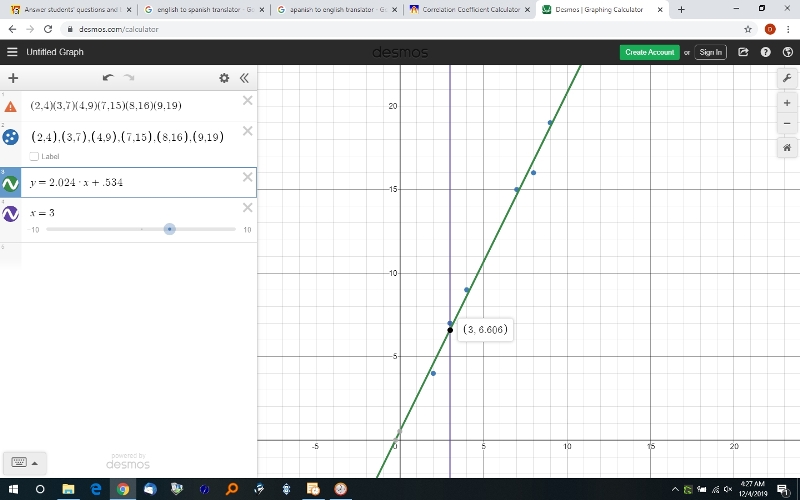
you can probably round this to y = 2.024 * x + .534 without any great loss of accuracy.
the rounded equation would look like this:
my inputs to the regression calculator look like this:
2,4
3,7
4,9
7,15
8,16
9,19
the equation is in the form of y = mx + b.
m is the slope
b is the y-intercept.
the slope is the average change in the value of y for each corresponding change in the value of x.
since y represents the number of pineapple plants in a garden in a given year, then the slope represents the average change in the number of pineapples in a given year divided by the average change in the number of years.
since the average change in the number of years is 1, then the slope represents the average change in the number of pineapple plants in the garden for each additional year.
the y-intercept is the value of y when the value of x is equal to 0.
since you did not have an actual point pair for when x = 0, this is just an approximation based on the regression line.
the actual value could have been 0 or it could have been 1.
a value for when x = 0 would have changed the equation of the regression line somewhat.
since the value was .534, you would probably round to 1, making the point (0,1).
the results of doing that are shown below:
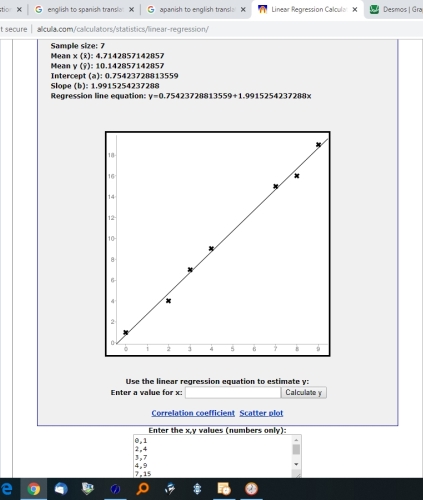
the rounded formula becomes y = 1.99 * x + .754
you can see that the y-intercept became closer to 1 and the slope was changed slightly.
the line is the line of best fit.
it's not right on, but the average distance between the points on the line and the actual points is minimized.
an example is when the value of x = 3.
the rounded formula in the original graph is y = 2.024 * x + .534 y =
when x = 3, the formula becomes y = 2.024 * 3 + .534.
the resulting value of y is 6.606.
you can see that on the graph using the rounded values.
the actual point is (3,7), so the linear regression line is close but not right on.
the closer the actual points are to the line, the better the approximation.
r is the correlation coefficient.
r^2 tells you how good of a fit you have.
the r for this data is 0.996 rounded to 3 decimal places.
the r^2 is the square of this.
r^2 = .996^2 = .992 rounded to 3 decimal places.
that's a pretty good fit.
the following reference explains the difference between r and r^2.
r is called the coefficient of correlation.
r^2 is called the coefficient of determination.
http://blog.uwgb.edu/bansalg/statistics-data-analytics/linear-regression/what-is-the-difference-between-coefficient-of-determination-and-coefficient-of-correlation/
Question 1144620: how do you find the line parallel to another line? with the equation?
Found 2 solutions by ikleyn, Alan3354:
Answer by ikleyn(52776) (Show Source):
Answer by Alan3354(69443)  (Show Source): (Show Source):
You can put this solution on YOUR website! how do you find the line parallel to another line? with the equation?
------------------
Not "the line." There are an infinite # of lines parallel to any given line.
-----
All parallel lines have the same slope.
=======================
If you know an equation of the given line, find its slope.
Put it in the "slope-intercept" form - that means solve for y.
---> y = mx + b
m is its slope.
====================
If you know a point that the 2nd line passes thru,
use y-y1 = m*(x-x1) where (x1,y1) is the point.
Question 1127750: In need of assistance please, as I am completely lost.
I was hoping to receive help understanding the following question:
A regression was run to determine whether there is a relationship between hours of TV watched per day(x)and number of sit-ups a person can do (y). The results of the regression are given below. Use this to predict the number of sit-ups a person who watches 11 hours of TV can do.
y=ax+b
a=−1.341
b=32.234
r=−0.896
What is really throwing me off is where "r" comes into play.
I am not simply seeking an answer, instead I am asking for your knowledge on how to understand this type of equation, and how to solve something such as this.
Thank you for your time!
Found 2 solutions by MathTherapy, MathLover1:
Answer by MathTherapy(10551)  (Show Source): (Show Source):
You can put this solution on YOUR website!
In need of assistance please, as I am completely lost.
I was hoping to receive help understanding the following question:
A regression was run to determine whether there is a relationship between hours of TV watched per day(x)and number of sit-ups a person can do (y). The results of the regression are given below. Use this to predict the number of sit-ups a person who watches 11 hours of TV can do.
y=ax+b
a=−1.341
b=32.234
r=−0.896
What is really throwing me off is where "r" comes into play.
I am not simply seeking an answer, instead I am asking for your knowledge on how to understand this type of equation, and how to solve something such as this.
Thank you for your time!
r is GIVEN and is needed to determine if there's a relationship/correlation between the 2 variables.

Since there is a correlation between the variables, the regression equation can be used to predict the dependent or y variable. If there was no

relationship/correlation between the 2 variables, then you would NOT be able to use the regression equation to predict the number of sit-ups

a person can do, or y. In that case, the mean of the dependent variable would be the BEST predictor of y, or the number of sit-ups a person can do.
Answer by MathLover1(20849) (Show Source):
You can put this solution on YOUR website!  =hours of TV watched per day =hours of TV watched per day
 number of sit-ups a person can do number of sit-ups a person can do

if given:


You actually do not need  to find . Also, when they say "use this", their meaning is "use this formula". to find . Also, when they say "use this", their meaning is "use this formula".

That's a formula for some variable . In other words, if you know what is, then you can find its associated value of . But, what does represent? If I told you,for example, that represent? If I told you,for example, that when when  , what is the meaning? , what is the meaning?
They gave you the values of the constants  and and  . .
Anytime you're given the value of a constant, you may substitute the given value for the symbol anywhere that symbol appears.
Finally, they gave you a value for . They want to know what will be for that value of ? . They want to know what will be for that value of ?
why  ? ?
We should compute the correlation coefficient only for data that follows a linear pattern or to determine the degree to  a data set is a data set is  . .
If the data exhibits a nonlinear pattern, the correlation coefficient for a linear regression is meaningless.
To get a sense for the relationship between the value of  and the graph of the data. and the graph of the data.
The correlation coefficient is a value, , between  and and  . .
 suggests a positive ( suggests a positive ( ) relationship ) relationship
 suggests a negative ( suggests a negative ( ) relationship ) relationship
The closer the value is to  , the , the   the data. the data.
The closer the value is to or , the   the data is. the data is.
You have . This value is very close to , which suggests a strong  relationship and the data is . relationship and the data is .
Question 1104406: Each week as part of her workout, Monica walks 0.5 mile, runs 1.6 miles, and then walks 0.75 mile.
How many total miles will Monica walk and run in a year? Reminder: there are 52 weeks in a year.
Enter your answer in the box.
Answer by math_helper(2461) (Show Source):
Question 1104771: In a study, nine tires of a particular brand were driven on a track under identical conditions. Each tire was driven a particular controlled distance (measured in thousands of miles) and the tread depth was measured after the drive. Tread depth is measured in �mils.� Here, 1 mil is 0.001 inch. The least-squares regression line was computed and added to a scatterplot of these data. On the plot, one data point is marked with an �X.� The equation of the least-squares regression line is:
Tread depth = 360.64 � 11.39x (thousands of miles)
Also, r2 = 0.953. We might feel comfortable using the least-squares regression equation to predict tread depth for a tire driven:
Answer by Theo(13342) (Show Source):
Question 1099202: The median price of an existing home was $160,000 in 2000 and $240,000 in 2007. If x represents the number of years since 2000, use these data points to determine a line of best fit for the trends in the price of existing homes. Write the equation in slope-intercept form.
Answer by josmiceli(19441)  (Show Source): (Show Source):
Question 1092803: Explain why the parabola shown in the figure below is not a good fit for the data.
Figure: http://www.intervisualtechnology.us/data/1/13720/2_6_image_apply.png
My answer was
"The parabola shown in the figure is not a good fit for the data because the y-values of the coordinates don�t align with the y-value of the parabola. To determine which function fits the data, we compare the y-values given by the data with the y-value of the function. The function with the closest y-values to the data is the best bit. With this figure, the parabola doesn�t seem to be the best fit for the data."
My teacher gave me an F for this. I'm not sure how else to explain it without the coordinates being provided. I would really appreciate help on this!!
Answer by Boreal(15235)  (Show Source): (Show Source):
You can put this solution on YOUR website! There are two things I see:
first, the y and x values are differently scaled. I would plot them using the same intervals between consecutive integers.
second, the parabola plotted does not go below one single point. The plots should at least include points on both sides of the curve. If this is a parabolic equation, it needs to be shifted downward. The best plot of any function minimizes least square distances between the points and the function. This plot if anything maximizes the differences.
Question 1087213: how come that (3,-2) and (4,-3) satisfy the equation: x-y>=5 in graphing the inequality when in fact R={x:x>5} and R={y:y<=-5}?
Try to plot the equation in this site
https://www.desmos.com/calculator
Answer by ikleyn(52776) (Show Source):
You can put this solution on YOUR website! .
This post has two parts:
Part 1:  "how come that (3,-2) and (4,-3) satisfy the equation: x-y>=5"

         This part contains the error: it must be the word "inequality" instead of "equation".


Part 2: the rest.

        Part 2 HAS NO ANY SENSE and is not relevant to Part 1.
When you post to the forum, please watch your words/terminology and your logic.
WATCH YOUR STEPS . . .
Question 1059688: A tree is 5 feet tall and grows at a rate of 6 feet a year.Write an Equation that relates years,x,and height of the tree,y.Use this equation to determine when it will be 17 feet tall.
Answer by josmiceli(19441) (Show Source):
Question 1055994: Researchers must be cautious when designing web-based surveys because they are particularly sensitive to:
A) All of the answer choices are correct
B) Undercoverage
C) Nonrespons
D) Voluntary response bias
Answer by ikleyn(52776) (Show Source):
Question 1055989: The regression equation below relates the scores student in an advanced statistics course received for homework completed and the subsequent midterm exam. Homework scores are based on assignments that proceeded the exam. The maximum homework score a student could obtain was 500 and the maximum midterm score was 350. The regression line that was obtained is given by:
Y= -94.4 + .91x
If a student had a homework score of 420, the midterm score would be predicted to be (round to an integer:
A) 298
B) 378
C) 336
D) None of the answer choices is correct
Answer by Boreal(15235) (Show Source):
You can put this solution on YOUR website! the homework score is independent (known) and on the x-axis. The midterm exam is on the y-axis
y=0.91x-94.4; x=420
y=382.2-94.4=287.8, or 288.
D.
Question 1046772: Need ASAP Please <3
1. Referring to the figure, find the slope of the line shown.
http://www.ppstest2.com/images2/AL4003.jpg
2. Referring to the figure, find the slope of the line shown.
http://www.ppstest2.com/images2/AL4004.jpg
Answer by Fombitz(32388)  (Show Source): (Show Source):
Question 1041925: Below is a graph for a dirt bike salesman after test riding several bikes. Extrapolate the distance that might be traveled after traveling for 60 minutes.
--------------------------------------------------------------------------------
5 miles
10 miles
6 2/3miles
40 miles
Answer by ikleyn(52776) (Show Source):
Question 1040374: 9. (14 pts) Life expectancy at birth is the estimated lifespan of a baby born in a particular year (given the conditions of that time period). Based on data retrieved from http://www.indexmundi.com/facts/united-states/life-expectancy-at-birth the following chart of U.S. life expectancy for males has been prepared.
img src= http://d2vlcm61l7u1fs.cloudfront.net/media%2F73f%2F73fe8e89-e840-4194-85c2-0c891fa17698%2FphpJRNuLz.png
The regression line is y = 0.2052x � 336.5, where x = birth year and y = U.S. life male expectancy, in years. The value of r2 is 0.9809.
(a) Use the regression line to estimate the U.S. life expectancy of a male baby born in 1970, to the nearest tenth of a year. Show some work.
(b) Use the regression line to predict the U.S. life expectancy of a male baby born in 2020, to the nearest tenth of a year. Show some work.
(c) What is the slope of the regression line and what are the units of measurement? In a sentence, interpret what the slope is telling us, in the context of this real-world application.
(d) What is the value of the correlation coefficient, r? Also, interpret its value: Looking at the graph and the size of r, do you judge the strength of the linear relationship to be very strong, moderately strong, somewhat weak, or very weak?
Answer by Boreal(15235) (Show Source):
You can put this solution on YOUR website! y = 0.2052x � 336.5
=(0.2052)(1970)-336.5=67.7 years
y=(0.2052)(2020)-336.5=78.0 years
slope of the line is 0.2052, and the units are rise/run which is age(in years)/year of birth
The real-world application is that age of male children born increases 0.336.5, a third of a year, for every year their birth is delayed. Or, male children born 10 years later will be expected to live about 3.4 years longer than their counterparts.
r=sqrt(0.9809)=0.99. This is a very high correlation and I would say the strength of the linear relationship is very strong.
Question 1025470: Which of the following correlations is the highest?
-.95
+75
-.05
+90
Answer by Fombitz(32388) (Show Source):
You can put this solution on YOUR website! Strongest correlation would be the one with the largest absolute value.
Some of you values are missing a decimal point since the strongest (and maximum value) correlation would be 1.
Question 1020318: A new water park has just opened in your city and you want to make sure you get as many water rides as possible for your money. The park has two cost plans for visitors. Each plan includes a fee for admission and an additional charge for each ride. You will get to decide which plan works best for you.
Plan A: Price of admission, $10, price per ride: $1.25
Plan B: Price of admission, $7, price per ride: $2.00
Complete the table for each plan to generate ordered pairs and create a graph to represent your results. Be sure to add numbers to the x and y axis before plotting your points. Highlight each plan a different color. Review your results and create an argument for which plan you feel is the better buy.
Just need some help laying out the graph. Thanks!
Answer by stanbon(75887) (Show Source):
You can put this solution on YOUR website! A new water park has just opened in your city and you want to make sure you get as many water rides as possible for your money. The park has two cost plans for visitors. Each plan includes a fee for admission and an additional charge for each ride. You will get to decide which plan works best for you.
Plan A: Price of admission, $10, price per ride: $1.25
Cost(A) = 10+1.25r; r can be 1,2,3,4,etc. to generate a graph of A-cost
Plan B: Price of admission, $7, price per ride: $2.00
Cost(B) = 7 + 2r; r can be 1,2,3,4 etc. to generate a graph of B-cost
-----
Complete the table for each plan to generate ordered pairs and create a graph to represent your results. Be sure to add numbers to the x and y axis before plotting your points. Highlight each plan a different color. Review your results and create an argument for which plan you feel is the better buy.
=====

-------------
Cheers,
Stan H.
--------------
Just need some help laying out the graph. Thanks!
Question 1019738: Find an equation for the line tangent to the curve when x has the first value
y=6√x
x=4
x=9
Answer by Alan3354(69443) (Show Source):
Question 1012906: Where will the vertices of the graphs of y = |2x-7| - c if c is any real number?
Found 2 solutions by MathTherapy, ikleyn:
Answer by MathTherapy(10551) (Show Source):
You can put this solution on YOUR website! Where will the vertices of the graphs of y = |2x-7| - c if c is any real number?
This is a piece-wise function, with standard form being:  , where (h, k) is the vertex , where (h, k) is the vertex
RETRACTION!
The coefficient of x in the piece-wise function is > 1, so to get the equation of the piece-wise function, the equation becomes:  . .
Therefore, the vertex, or (h, k) is at the coordinate point:  , which places the vertex in the 4th quadrant where h or the , which places the vertex in the 4th quadrant where h or the
x-coordinate is > 0, and k, or the y-coordinate is < 0
Answer by ikleyn(52776) (Show Source):
Question 1010723: is there a corralation between the number of doctors in an area and the number of pets. If yes, then is the corralation cause and effect.
Answer by Boreal(15235) (Show Source):
You can put this solution on YOUR website! It is not clear whether there is a correlation between the number of doctors in an area and the number of pets. If there were, it is not necessarily causal, unless there is a priori information that doctors have more pets than other people. If that were the case, then it would be causal, otherwise it would not be.
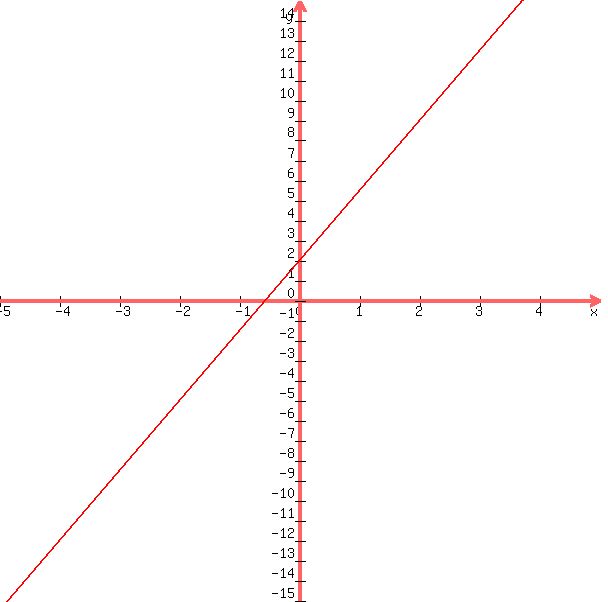
Question 1005651: The function y = 3.50x + 2 represents the total amount of money, y,
saved over x weeks.
What is true about the function?
A It is linear because it is always increasing.
B It is linear because it increases at a constant rate.
C It is nonlinear because it is always increasing.
D It is nonlinear because it increases at a constant rate.
Answer by Theo(13342) (Show Source):
You can put this solution on YOUR website! it is linear because it has a constant difference each time.
the difference can be positive or negative, but it will be constant.
they are referring to this constant difference when they say it is increasing at a constant rate.
selection B is the correct choice.
the function is:
y = 3.50 * x + 2
when x = 0, y = 0*3.50 + 2 = 2
when x = 1, y = 1*3.50 + 2 = 5.50
when x = 2, y = 2*3.50 + 2 = 9.00
when x = 3, y = 3*3.50 + 2 = 12.50
every time x increases by 1, y increases by 3.50.
3.50 is the constant rate of increase in this problem.
graphing of a linear function results in a straight line.
the graph of this function is shown below:
here's a good refernece on linear versus non-linear functions.
http://www.charleston.k12.il.us/cms/Teachers/math/PreAlgebra/paunit3/L3-3.PDF
Question 1005580: While conducting a study in his city, Braun noticed that as the price
of fuel oil increased, the price of gas increased. Braun also noted
that as the fuel oil price increased the number of cars on the streets
decreased. Select all of the conclusions Braun could draw from his
study.
A. An increase in fuel oil price causes a decrease in the number of cars
on the street.
B. A decrease in the number of cars on the street causes an increase in
gas price.
C. A decrease in the number of cars on the street causes an increase in
the fuel oil price.
D. An increase in fuel oil price causes an increase in the price of gas.
E. An increase in gas price causes a decrease in the number of cars on
the street.
Answer by stanbon(75887) (Show Source):
You can put this solution on YOUR website! While conducting a study in his city, Braun noticed that as the price
of fuel oil increased, the price of gas increased. Braun also noted
that as the fuel oil price increased the number of cars on the streets
decreased. Select all of the conclusions Braun could draw from his
study.
O = k*G/C
-----------------------
A. An increase in fuel oil price causes a decrease in the number of cars
on the street.
O and S are indirectly related
Therefore:: A is true
-------------------------
B. A decrease in the number of cars on the street causes an increase in
gas price.
C and G are directly related
Therefore B is false
-------------------------
C. A decrease in the number of cars on the street causes an increase in
the fuel oil price.
O and C are indirectly related
Therefore C is true
---------------------------
D. An increase in fuel oil price causes an increase in the price of gas.
O and G are directly related
Therefore D is true
---------------------
E. An increase in gas price causes a decrease in the number of cars on
the street.
G and C are directly related
Therefore E is false
----------
Cheers,
Stan H.
------------
Question 979359: ~~~~~~1. The graph shows how 10,000 is invested. After 10% of the amount that is invested in bonds is reinvested in CD's , how much money is invested in CD's?
Investment Portfolio
Bonds -- 50%
Stocks -- 25%
Mutual Funds -- 15%
CD --10%
My answer for the first one was 15%.
Answer by solver91311(24713) (Show Source):
You can put this solution on YOUR website!
You were right to say that 15% of the money was now invested in CDs, except that does not answer the question that was asked. The question asks, "how much money is invested in CDs?".
John

My calculator said it, I believe it, that settles it

Question 935309: _____when using midterm exam scores to predict a student's final grade in a class, the student would prefer to have a
A) positive residual, because that means the student's final grade is lower than we would predict with the model
B) positive residual, because that means the student's final grade is higher than we would predict with the model
C) residual equal to zero, because that means the student's final grade is exactly what we would predict with the model
D) negative residual, because that means the student's final grade is higher than we would predict with the model
E) negative residual, because that means the student's final grade is lower than we would predict with the model
*Could you please tell me step by step how to get the answer to the problem? Thank You so much for helping me !! :)
Answer by stanbon(75887) (Show Source):
You can put this solution on YOUR website! _____when using midterm exam scores to predict a student's final grade in a class, the student would prefer to have a
----
The residual associated with a data value is
the data value - the predicted data value for that value of "x".
residual = y(observed data value) - y(value predicted by the model)
-----
Answer::
B) positive residual, because that means the student's final grade is higher than we would predict with the model
----
Cheers,
Stan H.
-------------
Question 934763: 31st term: 1.40, 1.55, 1.70,
Answer by stanbon(75887) (Show Source):
You can put this solution on YOUR website! 31st term: 1.40, 1.55, 1.70
---
a = 1.4
d = 1.55-1.40 = 0.15
-----
a(31) = a + 30d = 1.4 + 30*0.15 = 5.9
------------
Cheers,
Stan H.
----------------
Question 930596: What is the y-intercept in y=mx+b?
Answer by Alan3354(69443) (Show Source):
|
|