SOLUTION: Ms. Lisa Monnin is the budget director for the New Process Company. She would like to compare the daily travel expenses for the sales staff and the audit staff. She collected the f
Algebra ->
Statistics
-> Hypothesis-testing
-> SOLUTION: Ms. Lisa Monnin is the budget director for the New Process Company. She would like to compare the daily travel expenses for the sales staff and the audit staff. She collected the f
Log On
Question 1205109: Ms. Lisa Monnin is the budget director for the New Process Company. She would like to compare the daily travel expenses for the sales staff and the audit staff. She collected the following sample information:
Sales ($)
131
135
146
165
136
142
Audit ($)
130
102
129
143
149
120
139
At the 0.10 significance level, can she conclude that the mean daily expenses are greater for the sales staff than the audit staff?
a. State the decision rule. (Round the final answer to 3 decimal places.)
Reject H0 if t >
1.363
.
b. Compute the pooled estimate of the population variance. (Round the final answer to 2 decimal places.)
Pooled estimate of the population variance
c. Compute the value of the test statistic. (Round the final answer to 3 decimal places.)
Value of the test statistic
d. State your decision about the null hypothesis.
Reject
H0 : μs ≤ μa.
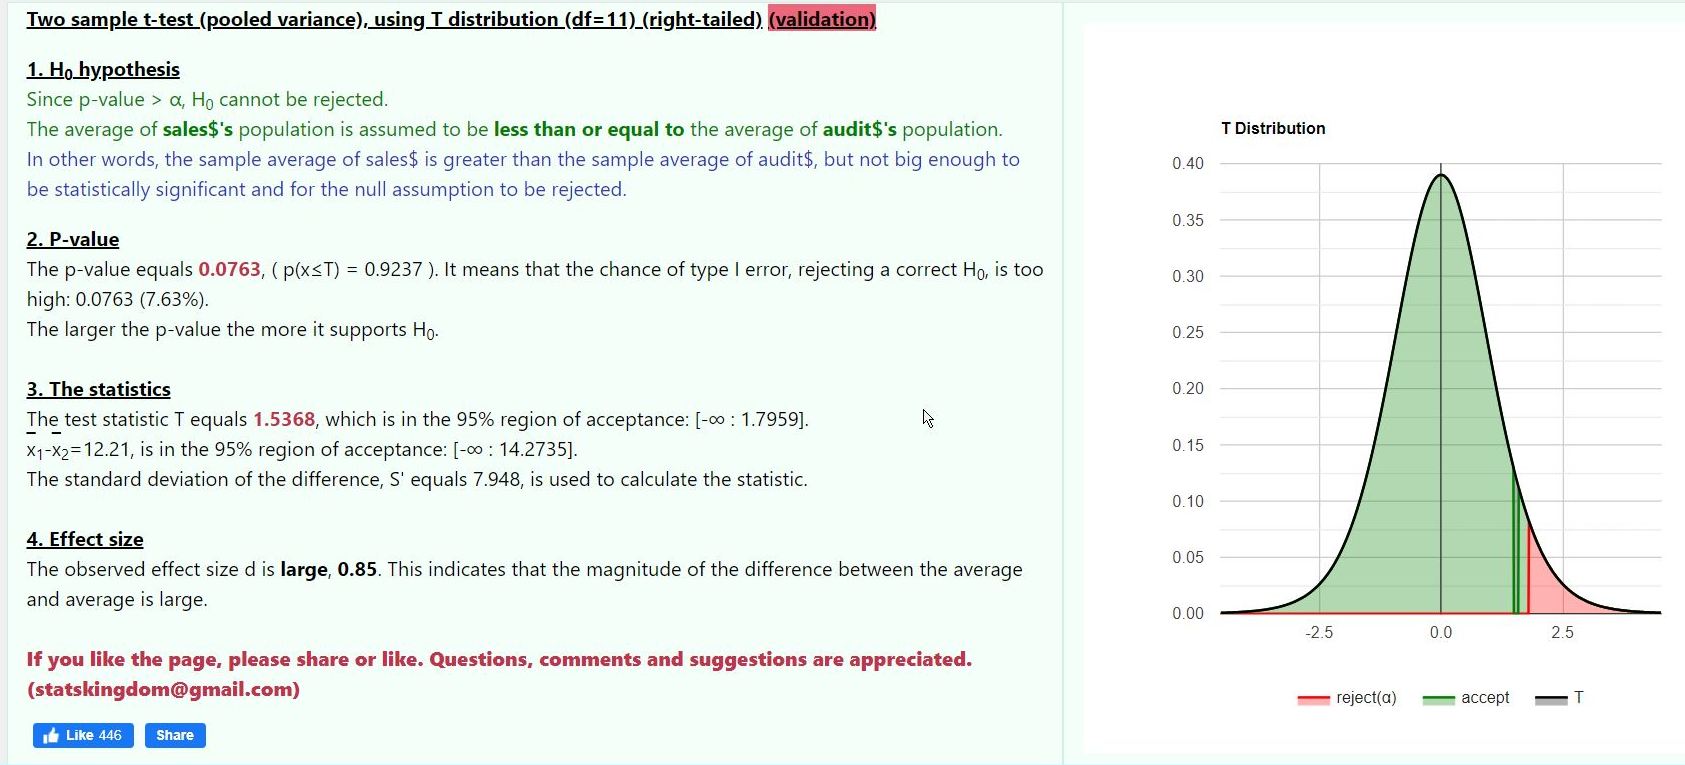
e. Estimate the p-value. (Round the final answer to 4 decimal places.)
the p-value of the test was .0763 which was less than the critical p-value of .10.
the test was a one tail test on the high side of the confidence interval because the criteria was to see if sales group mean was greater than audit group mean.
this placed the critical alpha all on the right side of the confidence interval.
the calculator calculated the mean of each sample and the variance of each sample.
the variances from both samples were then pooled to provide a common variance that was then used to calculate the standard error of the test.
i calculated the pooled variance manually and then calculated the standard error based on that reference and it agreed with the results of the calculator.
i also calculated the mean of each sample and the standard deviation of each ample and they also agreed with what the calculator showed.
my calculations showed the the mean of the sale data was 142.5 and the mean of the mean of the audit data was 130.285 (rounded results, not full detail).
my calculations also showed that the standard error was 7.94789.
i used those values to calculate the t-score with 11 degrees of freedom and got the following.
t = (142.5 - 130.285) / 7.94789 = 1.53688.
that was close enough for me to determine that the manual results and the calculator results were consistent with each other.
the pooled variance was equal to 5 * (12.24336)^2 + 6 * (15.787276)^2 / 11 = 204.084415.
the standard error was equal to the square root of that * sqrt(1/6 + 1/7) = 7.94789.
i also calculated the standard deviation of each sample using my ti-84 plus calculator..
it was 12.243365 for sale date an 15.787276 for audit data.
the variance for each would be the square of that.
bottom line:
the results were not significant indicating there was insufficient evidence to make the conclusion that mean of sales data was higher than mean of audit data.