SOLUTION: I need help on parts A through B its confusing and the boxplot wont show up on here when i tried put it in.
The following boxplot represents the team payroll salaries for all 200
Algebra ->
Statistics
-> Displaying-distributions
-> SOLUTION: I need help on parts A through B its confusing and the boxplot wont show up on here when i tried put it in.
The following boxplot represents the team payroll salaries for all 200
Log On
Question 1042204: I need help on parts A through B its confusing and the boxplot wont show up on here when i tried put it in.
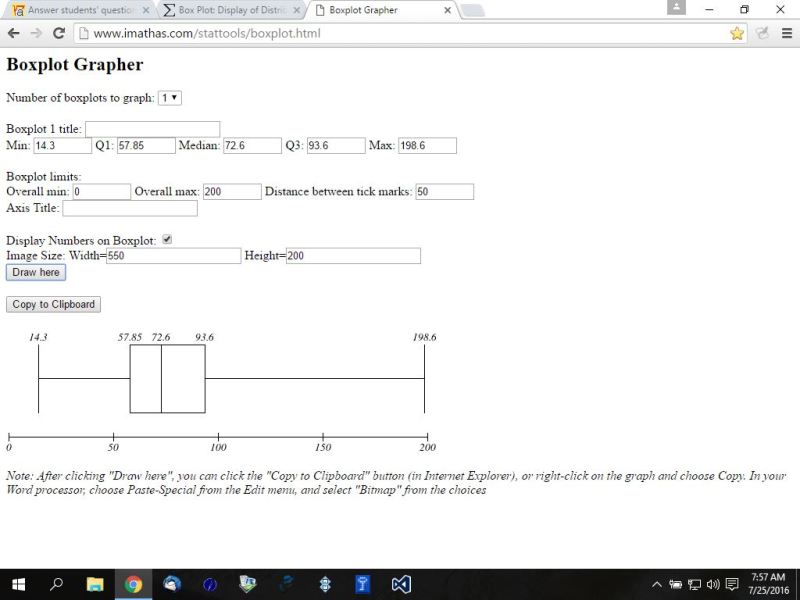
The following boxplot represents the team payroll salaries for all 2006 MLB teams:
These are the numbers under the boxplot. $14.3 mil $57.85mil $72.6mil $93.6 mil $198.6 mil
Fill in the blanks:
a) _____% of the MLB teams have payroll salaries greater than $72.6 million.
b) _____% of the MLB teams have payroll salaries greater than $93.6 million.
14.3 = minimum
57.85 = first quartile
72.6 = median
93.6 = third quartile
198.6 = maximum
the first quartile tells you that 25% of the numbers are less than that and 75% of the number are greater than that.
the median tells you that 50% of the numbers are less than that and 50% of the number are greater than that.
the third quartile tells you that 75% of the number are less than that and 25% of the numbers are greater than that.
the basic box plot divides the distribution into 4 quarters.
25% of the number are between the minimum and the first quartile.
25% of the numbers are between the first quartile and the median.
25% of the number are between the median and the third quartile.
25% of the numbers are between the third quartile and the maximum.
50% of the number are between the first quartile and the third quartile.
the difference between the first quartile and the third quartile is called the inter-quartile range.
your problem states:
These are the numbers under the boxplot.
$14.3 mil, $57.85 mil, $72.6 mil, $93.6 mil, $198.6 mil.
Fill in the blanks:
a) _____% of the MLB teams have payroll salaries greater than $72.6 million.
b) _____% of the MLB teams have payroll salaries greater than $93.6 million.
since 72.6 mil is the median, then 50% of the numbers are below and 50% of the numbers are above 72.6 mil.
since 93.6 mil is the third quartile, then 75% of the numbers are below and 25% of the numbers are above 93.6 mil.
answer to question a is 50%.
answer to question b is 25%.