|
Tutors Answer Your Questions about Displaying-distributions (FREE)
Question 1181437: A sports organization collected data about the shoe sizes of soccer players and hockey players. The dot plots show the data that was collected.
https://lh3.googleusercontent.com/fRqZqtUanbdDZQx61KXMiSR2uPcTACmN-HYtJjChkpHlywGYhwwyN4AIxiWKGjkZf5TVhr_SBdjsfbFhobMxmVeseTEXgRMV0A0Vdh6cPNHy8Fzykol9ttDEzJ93xMeeX-x7eUZ_
How do the medians of the data sets compare in terms of the mean absolute deviations of the data sets?
A. The median shoe size for the hockey players is 1.5 greater than the median shoe size for the soccer players, and the difference is 1.25 times the mean absolute deviation of either data set.
B. The median shoe size for the hockey players is 2 greater than the median shoe size for the soccer players, and the difference is 1.25 times the mean absolute deviation of either data set.
C. The median shoe size for the hockey players is 1.5 greater than the median shoe size for the soccer players, and the difference is 0.9375 times the mean absolute deviation of either data set.
D. The median shoe size for the hockey players is 2 greater than the median shoe size for the soccer players, and the difference is 0.9375 times the mean absolute deviation of either data set.
Is it A, B, C, or D?
Answer by CPhill(1959)   (Show Source): (Show Source):
You can put this solution on YOUR website! To compare the medians of the shoe sizes for soccer and hockey players in terms of their mean absolute deviations (MAD), we analyze the given data.
**Step 1: Calculate the Medians**
The median is the middle value of an ordered data set.
- **Soccer Players' Shoe Sizes:** Assuming the data set is: 5, 6, 6, 7, 7, 7, 8, 8, 9, 9, 10
- Number of data points: 11 (odd)
- Median: 7 (6th value)
- **Hockey Players' Shoe Sizes:** Assuming the data set is: 6, 7, 8, 8, 9, 9, 9, 10, 10, 11, 12
- Number of data points: 11 (odd)
- Median: 9 (6th value)
**Difference in Medians:** 9 (hockey) - 7 (soccer) = 2
**Step 2: Calculate the Mean Absolute Deviations (MAD)**
MAD is the average of the absolute deviations from the mean.
- **Soccer Players:**
- Mean: (5 + 6 + 6 + 7 + 7 + 7 + 8 + 8 + 9 + 9 + 10) / 11 ≈ 7.45
- Deviations: |5 - 7.45|, |6 - 7.45|, ..., |10 - 7.45|
- MAD: Sum of deviations / 11 ≈ 1.6
- **Hockey Players:**
- Mean: (6 + 7 + 8 + 8 + 9 + 9 + 9 + 10 + 10 + 11 + 12) / 11 ≈ 9
- Deviations: |6 - 9|, |7 - 9|, ..., |12 - 9|
- MAD: Sum of deviations / 11 ≈ 1.6
**Step 3: Compare the Difference in Medians to MAD**
Difference in medians: 2
MAD: 1.6
Ratio: 2 / 1.6 = 1.25
**Conclusion:**
The median shoe size for hockey players is 2 greater than that for soccer players, and this difference is 1.25 times the MAD of either data set.
**Answer:** B.
Question 1181438: A sports organization collected data about the shoe sizes of soccer players and hockey players. The dot plots show the data that was collected.
https://lh3.googleusercontent.com/fRqZqtUanbdDZQx61KXMiSR2uPcTACmN-HYtJjChkpHlywGYhwwyN4AIxiWKGjkZf5TVhr_SBdjsfbFhobMxmVeseTEXgRMV0A0Vdh6cPNHy8Fzykol9ttDEzJ93xMeeX-x7eUZ_
How do the medians of the data sets compare in terms of the mean absolute deviations of the data sets?
A. The median shoe size for the hockey players is 1.5 greater than the median shoe size for the soccer players, and the difference is 1.25 times the mean absolute deviation of either data set.
B. The median shoe size for the hockey players is 2 greater than the median shoe size for the soccer players, and the difference is 1.25 times the mean absolute deviation of either data set.
C. The median shoe size for the hockey players is 1.5 greater than the median shoe size for the soccer players, and the difference is 0.9375 times the mean absolute deviation of either data set.
D. The median shoe size for the hockey players is 2 greater than the median shoe size for the soccer players, and the difference is 0.9375 times the mean absolute deviation of either data set.
Is it A, B, C, or D?
Answer by CPhill(1959) (Show Source):
You can put this solution on YOUR website! To compare the medians of the shoe sizes for soccer and hockey players in terms of their mean absolute deviations (MAD), we analyze the given data.
**Step 1: Calculate the Medians**
The median is the middle value of an ordered data set.
- **Soccer Players' Shoe Sizes:** Assuming the data set is: 5, 6, 6, 7, 7, 7, 8, 8, 9, 9, 10
- Number of data points: 11 (odd)
- Median: 7 (6th value)
- **Hockey Players' Shoe Sizes:** Assuming the data set is: 6, 7, 8, 8, 9, 9, 9, 10, 10, 11, 12
- Number of data points: 11 (odd)
- Median: 9 (6th value)
**Difference in Medians:** 9 (hockey) - 7 (soccer) = 2
**Step 2: Calculate the Mean Absolute Deviations (MAD)**
MAD is the average of the absolute deviations from the mean.
- **Soccer Players:**
- Mean: (5 + 6 + 6 + 7 + 7 + 7 + 8 + 8 + 9 + 9 + 10) / 11 ≈ 7.45
- Deviations: |5 - 7.45|, |6 - 7.45|, ..., |10 - 7.45|
- MAD: Sum of deviations / 11 ≈ 1.6
- **Hockey Players:**
- Mean: (6 + 7 + 8 + 8 + 9 + 9 + 9 + 10 + 10 + 11 + 12) / 11 ≈ 9
- Deviations: |6 - 9|, |7 - 9|, ..., |12 - 9|
- MAD: Sum of deviations / 11 ≈ 1.6
**Step 3: Compare the Difference in Medians to MAD**
Difference in medians: 2
MAD: 1.6
Ratio: 2 / 1.6 = 1.25
**Conclusion:**
The median shoe size for hockey players is 2 greater than that for soccer players, and this difference is 1.25 times the MAD of either data set.
**Answer:** B.
Question 1187452: Using y=x²-2x²-5 to complete the table x=-3 to 5
Answer by MathLover1(20849)  (Show Source): (Show Source):
Question 1181436: A sports organization collected data about the shoe sizes of soccer players and hockey players. The dot plots show the data that was collected.
https://lh3.googleusercontent.com/fRqZqtUanbdDZQx61KXMiSR2uPcTACmN-HYtJjChkpHlywGYhwwyN4AIxiWKGjkZf5TVhr_SBdjsfbFhobMxmVeseTEXgRMV0A0Vdh6cPNHy8Fzykol9ttDEzJ93xMeeX-x7eUZ_
How do the medians of the data sets compare in terms of the mean absolute deviations of the data sets?
The median shoe size for the hockey players is 1.5 greater than the median shoe size for the soccer players, and the difference is 1.25 times the mean absolute deviation of either data set.
The median shoe size for the hockey players is 2 greater than the median shoe size for the soccer players, and the difference is 1.25 times the mean absolute deviation of either data set.
The median shoe size for the hockey players is 1.5 greater than the median shoe size for the soccer players, and the difference is 0.9375 times the mean absolute deviation of either data set.
The median shoe size for the hockey players is 2 greater than the median shoe size for the soccer players, and the difference is 0.9375 times the mean absolute deviation of either data set.
Answer by ikleyn(52776)  (Show Source): (Show Source):
You can put this solution on YOUR website! .
I see 4 (four, FOUR) identical posts.
FOUR is TOOOOOOOOOOOOOOOOOOOOO many.
Having two is MORE THAN ENOUGH.
Everything that is greater than 2 - - - IRRITATES.
Question 1179617: Solve by graphing. (If there is no solution, enter NO SOLUTION. Use the parameters x and y as necessary.)
x + y = 1
4x - y = -21
Found 2 solutions by Alan3354, josgarithmetic:
Answer by Alan3354(69443)  (Show Source): (Show Source):
You can put this solution on YOUR website! If there is no solution, enter NO SOLUTION.
----------------------
Do you think it's necessary to tell us that?
If there is no solution, we can do whatever we want.
Answer by josgarithmetic(39616) (Show Source):
Question 1138818: Use the sample data set below:
{51, 57, 43, 65, 72, 39, 56, 61, 48, 49, 37, 44, 68, 75, 52, 56, 41, 63}
Find the mean, median and variance to the nearest hundredth.
Answer by MathLover1(20849) (Show Source):
You can put this solution on YOUR website! The mean is:

Median:
put terms in order from lowest to highest
 , , , , , , , , , , , ,  , , , , ,|| ,|| , , , , , , , , , , , , , , , ,

to find standard deviation, create the following table:
 ..... ..... ..... .....
..... ..... .....
..... ..... .....
..... ..... .....
..... ..... .....
..... ..... .....
..... ..... .....
..... ..... ..... 
..... ..... .....
 ..... ..... ..... .....
..... ..... .....
..........
..... ..... .....
..... ..... .....
..... ..... .....
..... ..... .....
..... ..... .....
..... ..... .....
..... ..... .....
the sum of numbers in the last column above is: 
divide it by  where where  is the number of elements, in your sample is the number of elements, in your sample 

Question 1127296: 2. A pet food company wants to know the number of pets owned by adults ages 21 to 70. The frequency table shows the data from a simple random sample of the targeted population.
Total pets owned 1 2 3 4 5 6 7
Number of adults 248 567 1402 728 419 456 203
What is the estimated mean for the population? Explain your answer and show your work.
Answer by Boreal(15235)  (Show Source): (Show Source):
You can put this solution on YOUR website! The mean is the number of pets * number of adults
all divided by the total number of adults
1*248=248
2*567=1134
3*1402=4206
4*728=2912
5*419=2095
6*456=2736
7*203=1421
Number of adults=4023
pets*adults sum is 14752
divide 14752/4023=3.67 pets per adult is the mean or expected value.
Question 1126975: two consecutive odd integers as such that the greater added to twice the matter gives 5, find the integers
Found 2 solutions by math_helper, Alan3354:
Answer by math_helper(2461)  (Show Source): (Show Source):
You can put this solution on YOUR website! two consecutive odd integers as such that the greater added to twice the matter gives 5, find the integers
�����
two consecutive odd integers as such that the greater added to twice the  smaller gives 5, find the integers smaller gives 5, find the integers
�����
Let n = the smaller, then n + 2 is the larger.
(n+2) + 2(n) = 5
3n + 2 = 5
3n = 3
n = 1 �> n+2 = 3
��
Ans: 1 and 3
��
Answer by Alan3354(69443) (Show Source):
Question 1125154: 14m+m+17m−9m if m=30
Answer by josgarithmetic(39616) (Show Source):
Question 1108998: A and B start walking in opposite directions. A walked 2km and B walked 3km. Then each turned right and walked 4km. Then they turned right. A walked 3km and B walked 2km. How far distance apart are they at the end?
Answer by math_helper(2461) (Show Source):
You can put this solution on YOUR website!
8 km
�������
Assuming they start at the origin and A heads East along the +x axis, then A ends up at (-1,-4) while B ends up at (-1,4). [ If you assume A heads West first then A ends at (1,4) and B ends at (1,-4) ... so even though their ending places are different, the distance between them is the same, 8km. ]
Question 1074990: A die is in the shape of a cube. The length of an edge is 2.3 centimeters. What is its surface area in square centimeters
Answer by ankor@dixie-net.com(22740)  (Show Source): (Show Source):
Question 1042204: I need help on parts A through B its confusing and the boxplot wont show up on here when i tried put it in.
The following boxplot represents the team payroll salaries for all 2006 MLB teams:
These are the numbers under the boxplot. $14.3 mil $57.85mil $72.6mil $93.6 mil $198.6 mil
Fill in the blanks:
a) _____% of the MLB teams have payroll salaries greater than $72.6 million.
b) _____% of the MLB teams have payroll salaries greater than $93.6 million.
Answer by Theo(13342)  (Show Source): (Show Source):
You can put this solution on YOUR website! the box plot numbers are:
14.3
57.85
72.6
93.6
198.6
the basic box plot gives you:
the minimum
the first quartile
the median
the third quartile
the maximum
here's a picture of the basic boxplot
http://www.physics.csbsju.edu/stats/box2.html
based on that, your numbers are:
14.3 = minimum
57.85 = first quartile
72.6 = median
93.6 = third quartile
198.6 = maximum
the first quartile tells you that 25% of the numbers are less than that and 75% of the number are greater than that.
the median tells you that 50% of the numbers are less than that and 50% of the number are greater than that.
the third quartile tells you that 75% of the number are less than that and 25% of the numbers are greater than that.
the basic box plot divides the distribution into 4 quarters.
25% of the number are between the minimum and the first quartile.
25% of the numbers are between the first quartile and the median.
25% of the number are between the median and the third quartile.
25% of the numbers are between the third quartile and the maximum.
50% of the number are between the first quartile and the third quartile.
the difference between the first quartile and the third quartile is called the inter-quartile range.
your problem states:
These are the numbers under the boxplot.
$14.3 mil, $57.85 mil, $72.6 mil, $93.6 mil, $198.6 mil.
Fill in the blanks:
a) _____% of the MLB teams have payroll salaries greater than $72.6 million.
b) _____% of the MLB teams have payroll salaries greater than $93.6 million.
since 72.6 mil is the median, then 50% of the numbers are below and 50% of the numbers are above 72.6 mil.
since 93.6 mil is the third quartile, then 75% of the numbers are below and 25% of the numbers are above 93.6 mil.
answer to question a is 50%.
answer to question b is 25%.
a picture of your box plot would look like this:
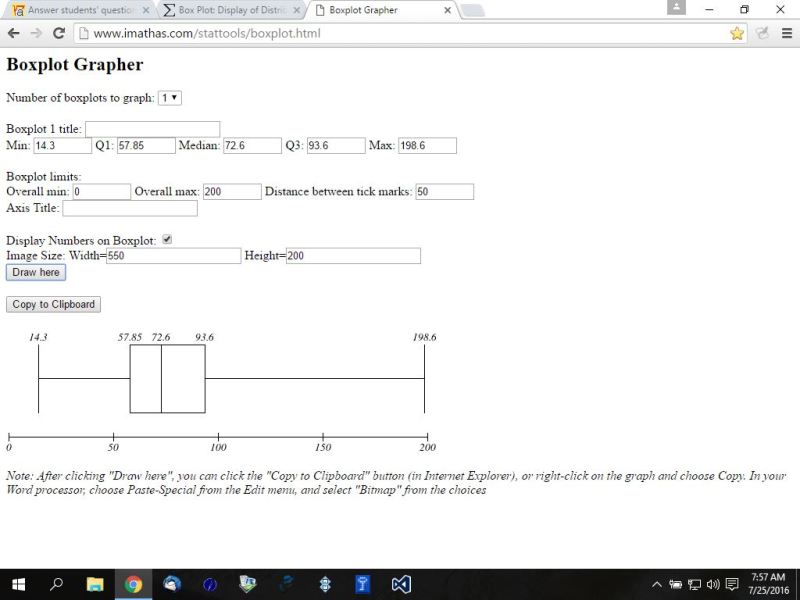
the link to the box plot grapher is shown below.
http://www.imathas.com/stattools/boxplot.html
Question 1018026: How do I calculate the probability that at least one in a group of 10 NYC teenagers smoked in 2007? 2001? 1997? I just don't know where to begin on this, I feel so lost! I know I should know this but I don't.
Answer by richard1234(7193)  (Show Source): (Show Source):
Question 994065: There are 31 participants in a special high-adventure camp. Following is a list of the age of the participants.
16, 18, 13, 24, 17, 17, 18, 14, 14, 16, 14, 20, 22, 21, 15
11, 13, 26, 27, 13, 16, 17, 17, 14, 19, 15, 17, 16, 19, 19, 28
Construct a histogram of the participants' age with a class width of 5.
Answer by solver91311(24713)  (Show Source): (Show Source):
You can put this solution on YOUR website!
I'm not going to do this problem for you because it is just grunt work. If you write back and tell me what it is that you don't understand about the question, I'll try to explain it.
John

My calculator said it, I believe it, that settles it

Question 990031: A survey of 126 college students was taken to determine the musical styles they liked. Of those 39 students listened to rock, 42 to classical and 2 to jazz. Also 20 students listened to rock and jazz,11 to rock and classical, and 21 to classical and jazz. Finally, 6 students listened to all musical styles. Construct a Venn Diagram and determine the cardinality for each region.
Answer by stanbon(75887) (Show Source):
You can put this solution on YOUR website! A survey of 126 college students was taken to determine the musical styles they liked. Of those 39 students listened to rock, 42 to classical and 2 to jazz. Also 20 students listened to rock and jazz,11 to rock and classical, and 21 to classical and jazz. Finally, 6 students listened to all musical styles. Construct a Venn Diagram and determine the cardinality for each region.
-------
Draw 3 intersecting circles inside a rectangle(126).
Label the circles rock(39), classical(42), jazz(2)
-----
There are 6 students in the intersection of all three circles.
Notice:: That means there are more than 2 in "jazz".
-----
Notice you already have 6 in the intersection of r/j, r/c, and c/j
Put 20-6 = 14 in the intersection of rock and jazz
Put 11-6 = 5 in the intersection of rock and classical
Put 21-6 = 15 in the intersection of classical and jazz
-------------
Put the correct numbers in the remaining sections
of r, c, and j
------------
Count the total number in r, in c, and in j
-------------
Cheers,
Stan H.
--------
Question 950712: Hi I need help with these radical equation questions. Thanks in advance :)
Solve each equation and check for extraneous solutions:
1. [sqrt(2x^2 - 1)]=x
A.[sqrt(1/3)]
B.{-1,1}
C.{-1/2,1}
D.1
E.0
F.none of the above
2.[sqrt(2x^2 + 5x + 6)]=x
A.no solution
B.{-2,-3}
C.{2,3}
D.-2
E.3
F.0
3. [sqrt(x + 3)] = 2[SQRT(x)]
A.no real solution
B.3
C.{-3,3}
D.0
E.3/2
F.1
4.[sqrt(2x^2 + x - 12)] = x
A.[sqrt(6)]
B.3
C.no solution
D.[sqrt(12)]
E.2
F.{-2,2}
5.[sqrt(2x^2 + 6x + 4)] = x + 1
A.1
B.{-3, -1}
C.{-3/2, -1}
D.no solution
E.-1
F.-3
Answer by MathLover1(20849) (Show Source):
Question 941928: Consider the graph of the following parabola:
y = 2x� - 3
Does the parabola open upward or downward?
Answer by Edwin McCravy(20054)  (Show Source): (Show Source):
You can put this solution on YOUR website! `
Upward, because when solved for y the coefficient of x� is positive.
`
[BTW, when the coefficient of x� is negative, it opens downward]
Question 934376: A survey of 180 college men was taken to determine participation in campus activities. 43 were in fraternities, 52 participated in campus sports, and 35 participated in various tutorial programs. 13 students participated in fraternities and sports, 14 in sports and tutorials, and 12 in fraternities and tutorial programs. Five students participated in all three activities.
Answer the questions below, and document your work using a Venn Diagram.
a. How many participated in only campus sports?
b. How many participated in fraternities and sports, but not in tutorial programs?
c. How many participated in fraternities or sports, but not in tutorial programs?
d. How many participated in exactly one of the three activities?
e. How many participated in at least two of the activities?
f. How many did not participate in any of the three activities?
Answer by Rosseta786(21)  (Show Source): (Show Source):
You can put this solution on YOUR website! Sorry I cannot answer your questions as there at too many and in the rules it say one question per message as you are only allowed 5 a day and If I answer all your questions it will be unfair on other people.
Question 935109: Sara's math grades for 3 marking quarters were 86, 99, 73, 76, 83, 92, 85, 66, 66, 77. Create stem-leaf plot and justify, bar graph, line graph, and pie chart.
Answer by MathLover1(20849) (Show Source):
You can put this solution on YOUR website!
86, 99, 73, 76, 83, 92, 85, 66, 66, 77
stem-leaf plot
 |,-means you have |,-means you have  and and
 | | , , ,-means you have ,-means you have  ,and ,and
 |,,-means you have |,,-means you have  , , and and
 | | ,-means you have ,-means you have  and and
here are bar graph, line graph, and pie chart:
http://postimg.org/gallery/jxpi8b4y/fe1931e0/
Question 928180: The following table shows the age distribution of representatives in the US in 2005
under 40 40-49 50-59 60-69 70-79 80 and over
47 151 128 89 12 3
How many representatives were there in the US congress in2005? What percentage of them were at least 70 years old?
I put 12% of them were at least the age of 70 years old. Please help me and tell me why I am wrong.
Answer by ewatrrr(24785)  (Show Source): (Show Source):
You can put this solution on YOUR website!
Hi

Re TY: What percentage of them were at least 70 years old? p( ≥ 70) =

<40          40-49    50-59   60-69   70-79   80 and over         TOT

    47           151        128      89         12           3                  430

 = 3.49 % = 3.49 %
|
|
| |