SOLUTION: Fuel economy estimates for automobiles built in a certain year predicted a mean of 26.2 mpg and a standard deviation of 5.8 mpg for highway driving. Assume that a normal distributi
Algebra ->
Statistics
-> Density-curves-and-normal-distributions
-> SOLUTION: Fuel economy estimates for automobiles built in a certain year predicted a mean of 26.2 mpg and a standard deviation of 5.8 mpg for highway driving. Assume that a normal distributi
Log On
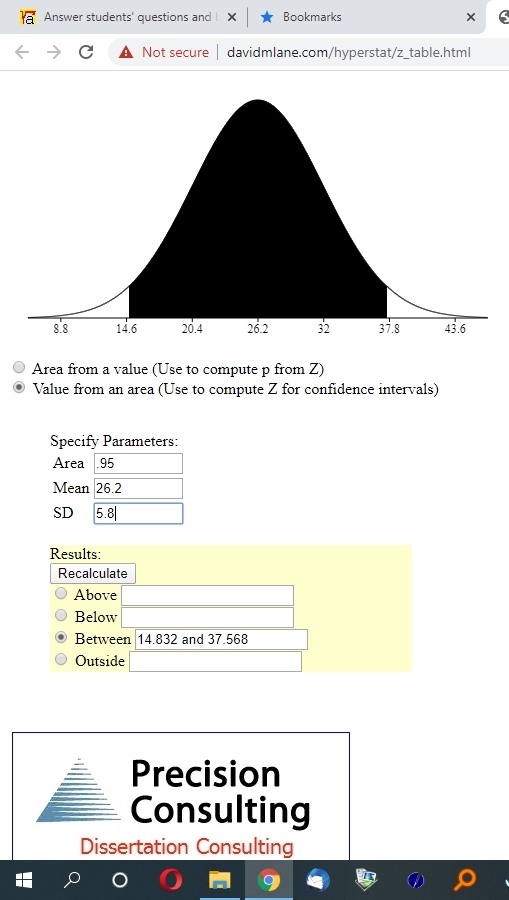
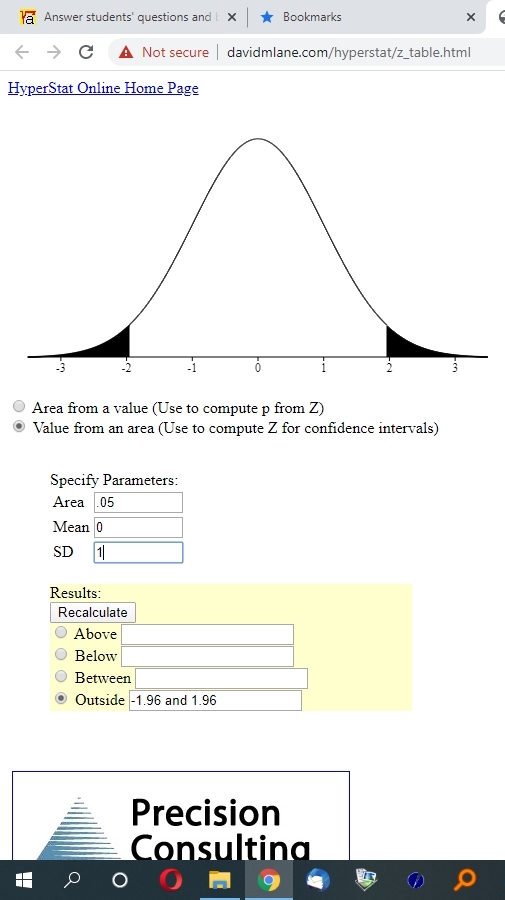
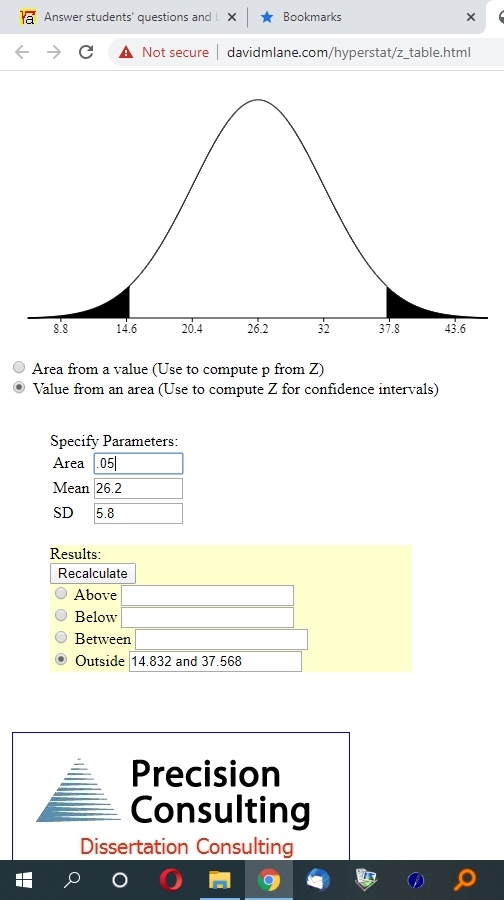
Question 1155349: Fuel economy estimates for automobiles built in a certain year predicted a mean of 26.2 mpg and a standard deviation of 5.8 mpg for highway driving. Assume that a normal distribution can be applied. Within what range are 95% of the automobiles? Answer by Theo(13342) (Show Source):
You can put this solution on YOUR website! mean is 26.2 and standard deviation is 5.8.
at 95.
at two sides 95% confidence level, the alpha on each end is .025.
the z-score with an area of .025 to the left of it under the normal distribution curve will have a z-score of -1.959963986.
since the normal distribution curve is symmetric about the mean, the z-score with an area of .025 to the right of it under the normal distribution curve will have a z-score of 1.959963986.
the z-score formula is z = (x - m) / s
z is the z-score.
x is the raw score.
m is the raw mean.
s is the raw standard deviation.
for the high z-score, you get 1.959963986 = (x - 26.2) / 5.8.
solve for x to get x = 5.8 * z + 26.2 = 37.56779112.
for the low z-score, you get -1.959963986 = (x - 26.2) / 5.8.
solve for x to get x = 5.8 * z + 26.2 = 14.83220888.
visually, this would look like this.
first is with z-score.
second is with raw score.
differences in values are due to rounding differences.
note that z-score and raw score between .95 and outside .05 will be the same.
outside, takes 1 - .95 and divides it by 2 to get .025 on each end.
first is with z-score.
second is with raw score.