Question 96232: By graphing the points and setting up a common difference table, determine if the following data points form a constant, linear, quadratic or none of these types. Explain your choice.
To manufacture 4 VCRs cost $160
To manufacture 5 VCRs cost $200
To manufacture 6 VCRs cost $240
To manufacture 7 VCRs cost $280
Plot the data on a graph paper. Note, be sure to label your axes properly.
Next, Fill out the common difference table for the date
_______________________________________________________________________________
1st CD 2nd CD
_______________________________________________________________________________
_______________________________________________________________________________
_______________________________________________________________________________
_______________________________________________________________________________
_______________________________________________________________________________
(Note) there are actually (4) colums that make up this table. (2) Blank rows then (2) rows that represent the info that goes into the 1st and 2nd CD columns.
Type of Function is?
A) Constant B)Linear C) Quadratic D) None of these types
Explanation of why you chose the above type?_________________________________
Answer by tutorcecilia(2152)   (Show Source): (Show Source):
You can put this solution on YOUR website! Let VCRs = x
Let Cost =y
Use the formula for the slope (m) of a line:
m=
.
Pick any two points and plug-in the y1, y2, x1, and x2 values:
I picked points (4, 160) and (5, 200)
.
m=
m=
m=
.
Use the formula for the slope-intercept equation of a line:
y=mx+b
Pick one point and plug it into the equation, plug-in the slope and solve for the b-value:
I picked point (4, 160)
160=(40)(4)+b
160=160+b
160=160=b
0=b
.
Plug-in the value of the slope and the value of the b-term:
y=40x+0
or y=40x
or f(x)=40x
This is the slope-intercept form of the equation of line.
This is a (B) LINEAR EQUATION because as the x-value goes up, the corresponding y-values goes up; as x-value x goes down, the corresponding y-values goes down.
.
.
The common difference will be (1) because:
5-4=1
6-5=1
7-6=1, etc.
I do not understand what is need in the rest of the table.
.
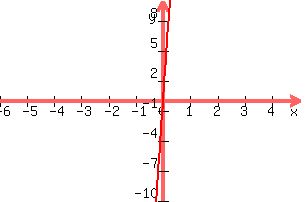
Graphing: The line will cross the y-axis at (0,0). Plot the following points and connect the lines to get the graph below: ((-3, -120) (-1, -40) (0, 0) ( 2, 80) (4, 160) (6, 240), etc.
 . .
|
|
|