Question 943039: So I'm trying to graph a parabola. I already have an equation for it, I just need to find the vertex, and two other points and then graph it. The equation given is x^2 +3y=0....I have no idea what to do next? Please help! Thank you!
Found 2 solutions by MathLover1, KMST:
Answer by MathLover1(20849)   (Show Source): (Show Source):
You can put this solution on YOUR website!


since the vertex form of parabola is  where where  and and  coordinates of the vertex, if we compare it to we see that coordinates of the vertex, if we compare it to we see that  , ,  and and  ; so, the vertex is at origin ( ; so, the vertex is at origin ( ,) ,)
make table:
 , ,
,
 , ....... , .......
 , ....... , .......
 , , ....... .......
 , ....... , .......
plot points and draw a line through:

Answer by KMST(5328)  (Show Source): (Show Source):
You can put this solution on YOUR website! The graph of a parabola looks like this  or like this or like this 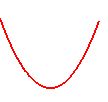 . .
First, solve for :
<--> <--> <-->
That lat equation allows you to calculate points easily:
you pick a value for 
(for example, for  , ,  ). ).
Looking at that equation, you realize that:
for  , ,  , and , and
for  (negative or positive), (negative or positive),  and and  . .
That tells you that the graph looks like this:
 It has a maximum at It has a maximum at  , the origin, , the origin,
and all the other points are below the x-axis, with  . .
In general a parabola with vertex at  has an equation of the form has an equation of the form
 <---> <--->  <---> <--->  . .
You may be told that it is a quadratic function of the form  , ,
but that is the same thing,
with  and and  . .
In any case, you can find , the x-coordinate of the vertex,
by changing the sign of the coefficient of the term in ,
to get  , ,
and dividing by  , twice the coefficient of the term in , twice the coefficient of the term in  , ,
to get  . .
After that, you just plug that value of into the equation and find ,
the y-coordinate of the vertex.
For example,
 has has  and and  . .
The x-coordinate of the vertex of the parabola with that equation is
 . .
The y-coordinate of the vertex is
 . .
|
|
|