Question 941811: Juan is driving on the highway. He begins the trip with
18
gallons of gas in his car. The car uses up one gallon of gas every
20
miles.
Let
G
represent the number of gallons of gas he has left in his tank, and let
D
represent the total distance (in miles) he has traveled. Write an equation relating
G
to
D
, and then graph your equation using the axes below.
Answer by josmiceli(19441)   (Show Source): (Show Source):
You can put this solution on YOUR website! [( 1 gallon ) / ( 20 mi )] x D = ( gallons used )
 = gallons used = gallons used
for instance, if he travels  mi, then mi, then
( gallons used ) = 
---------------------------
( gallons left in tank ) = ( 18 gallons ) - ( gallons used )

-----------------------
This is the equation to use, but if you have to graph it,
you need to decide which variable is dependent and
which variable is independent.
You have to choose between:
(1) G depends on D
OR
(2) D depends on G
----------------------
(1) is correct, because the gallons I have left in my tank
DEPENDS on how far I have driven
----------------------
So, G is the DEPENDENT variable, and that makes
D the INDEPENDENT variable
----------------------
The independent variable is always plotted on the
horizontal axis
The dependent variable is always plotted on the
vertical axis
-----------------------
So, I want my equation to look like:
 , so it is correct as shown: , so it is correct as shown:
Here's the plot:
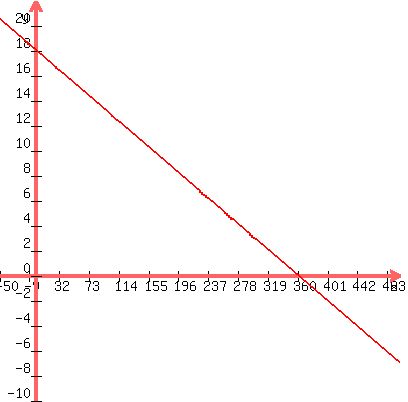
The graph looks OK
If  , , 
If  , , 
|
|
|