
 round up to 2. So the histogram will only have
two bars.
We start at the bottom, the "x-axis" and build up.
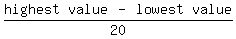
The first bar will start at 0.5 less than the lowest value,
59-0.5=58.5.
We add 20, getting 78.5, and mark that at the end of
the first bar, which will also be the beginning of the second bar.
Then we add 20 to 78.5, getting 98.5. Since we have only two bars,
that's the end of the histogram's horizontal axis.
Now we start stacking the numbers up into into which of the two
categories they belong in.
We start by stacking the first number in the list, 81, in the bar
on the right because it's between 78.5 and 98.5. Then we stack the
next number 70 on the left bar. Then 73 goes on top of the 70
because it's between 58.5 and 78.5, then 89 goes on the right bar
on top of the 81 because its between 78.5 and 98.5, and so on and
so forth. We end up with this:
____
| 67 |____
| 77 | 82 |
| 65 | 94 |
| 75 | 82 |
| 73 | 88 |
| 77 | 80 |
| 59 | 91 |
| 68 | 79 |
| 73 | 89 |
| 70 | 81 |
-----------
58.5 78.5 98.5
Then we erase all the numbers we-ve stacked up
and just leave the bars:
____
| |____
| | |
| | |
| | |
| | |
| | |
| | |
| | |
| | |
| | |
-----------
58.5 78.5 98.5
Or you teacher might not care if you leave the
numbers in there. But you were probably told
just to count the number of numbers that go in
each bar and make the bars that high and not
stack the numbers up. But I think it's easier
to stack the numbers up. You end up with the
same histogram either way.
Edwin
 round up to 2. So the histogram will only have
two bars.

We start at the bottom, the "x-axis" and build up.

The first bar will start at 0.5 less than the lowest value,
59-0.5=58.5.

We add 20, getting 78.5, and mark that at the end of
the first bar, which will also be the beginning of the second bar.

Then we add 20 to 78.5, getting 98.5. Since we have only two bars,
that's the end of the histogram's horizontal axis.

Now we start stacking the numbers up into into which of the two
categories they belong in.

We start by stacking the first number in the list, 81, in the bar
on the right because it's between 78.5 and 98.5.  Then we stack the
next number 70 on the left bar. Then 73 goes on top of the 70
because it's between 58.5 and 78.5, then 89 goes on the right bar
on top of the 81 because its between 78.5 and 98.5, and so on and
so forth.  We end up with this:
   ____
  | 67 |____
  | 77 | 82 |
  | 65 | 94 |
  | 75 | 82 |
  | 73 | 88 |
  | 77 | 80 |
  | 59 | 91 |
  | 68 | 79 |
  | 73 | 89 |
  | 70 | 81 |
  -----------
58.5  78.5 98.5

Then we erase all the numbers we-ve stacked up
and just leave the bars:

   ____
  |    |____
  |    |    |
  |    |    |
  |    |    |
  |    |    |
  |    |    |
  |    |    |
  |    |    |
  |    |    |
  |    |    |
  -----------
58.5  78.5 98.5

Or you teacher might not care if you leave the
numbers in there.  But you were probably told
just to count the number of numbers that go in
each bar and make the bars that high and not
stack the numbers up.  But I think it's easier
to stack the numbers up.  You end up with the
same histogram either way.

Edwin

