Question 920682: Very confused, Please explain how this works
I have to make a graph for this sine function:
g(x) = -2sin(πx+π/3)
I know what the graph looks like but I need to know how to make it myself
I found:
Amp = 2
Period = 2
Phase shift = -1/3
I know the end position is 5/3 because -1/3+2/1 = 5/3. Right?
What determines the points from -1/3 to 5/3 on the x-axis?
And from -1/3 I don't know where the line enters the y-axis I know the range is between 2 and -2 but when I see the graph it shows the line going from -1/3 and entering above the -2, why is this? Please I really need help on this
Thank you
Answer by KMST(5328)   (Show Source): (Show Source):
You can put this solution on YOUR website! What you worked out is useful and correct.
I would look at it like this:
I know what   looks like. looks like.
It looks like this 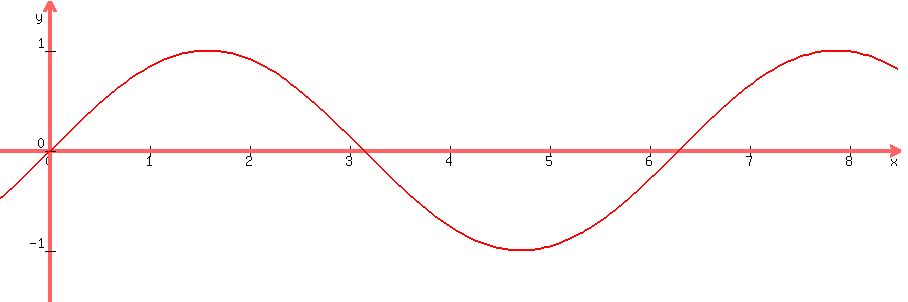 , ,
crossing the x-axis at  , ,  , ,  , and so on. , and so on.
Making it   compresses it horizontally a bit, compresses it horizontally a bit,
very conveniently making it cross the x-axis at ,  , ,  , etc: , etc:
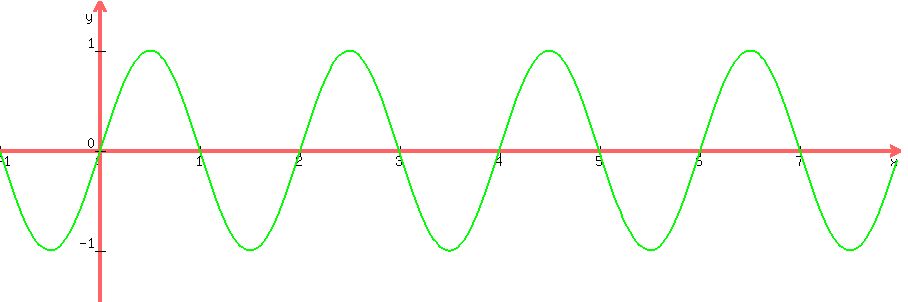 . .
Then,   = = = =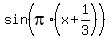 = =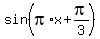
crosses the x-axis when
 <---> <---> , ,
 <---> <---> , ,
 <---> <---> , etc. , etc.
In fact the graph of   
looks just like the graph of  , ,
but with all the points moved  to the left: to the left:
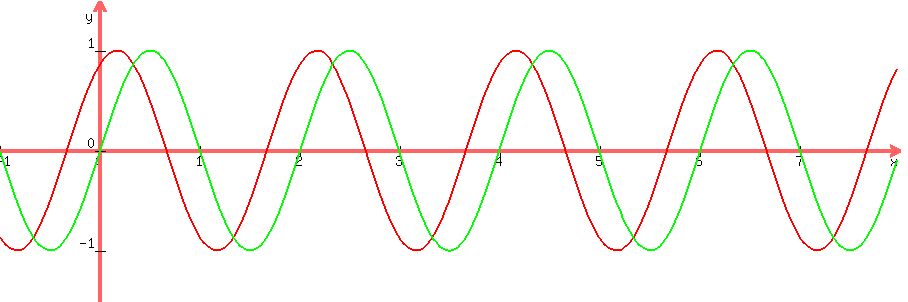 . .
Now, the graph of  
Is similar, but twice as tall (stretched vertically, and flipped about the x-axis:
 . .
|
|
|