|
Question 90420: Graph f(x) = 4x + 1.
Answer by bucky(2189)   (Show Source): (Show Source):
You can put this solution on YOUR website! Given:
.

.
You are to graph this.
.
Just to get into a more familiar form, substitute y for f(x). With this substitution
the equation becomes:
.

.
Probably the easiest way to do this is to substitute some values of x into the equation
and compute the corresponding values of y. Each substitution will give you another point on
the graph.
.
For example. Assume the value of x is zero. Substituting 0 for x in the equation results
in:
.

.
So you can say that when x = 0, y = 1. This is the (x, y) point (0, 1) and is on the graph.
.
Another easy value for x is to assign it a value of +1. When x equals +1 the equation
becomes:
.
 . This tells you that the (x, y) point (1, 5) is on the graph . This tells you that the (x, y) point (1, 5) is on the graph
also.
.
If you plot these two points on your coordinate system and draw a straight line through
them you have the graph you are looking for. But it is usually a good idea to plot a
couple of more points, just to ensure that all the points line up. If some of the points
are out of alignment ... and are not in a straight line, then you have a mistake and you need
to find the error.
.
So let's do another couple of values for x. Assume that x equals 2. If you substitute
2 for x in the equation you get:
.
 . So the point (2, 9) should also be on the graph. . So the point (2, 9) should also be on the graph.
.
Now choose a negative value for x. Suppose x = -1. Substituting this value for x results
in a value for y of  . This says that the point (-1, -3) is . This says that the point (-1, -3) is
on the graph. All four of the points we calculated should lie in a straight line so
a straight line can be run through these points. This straight line is the graph you
are looking for.
.
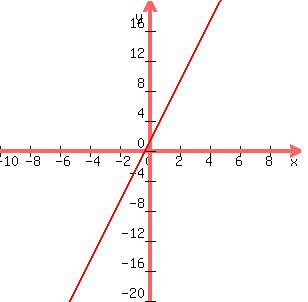
When you get done with the graph it should look like:
.
.
Hope this helps you to understand graphing a little better.
.
|
|
|
| |