Graph the inequality.
y > 3x
First form the equation of the boundary line.
To get the equation of the boundary line, just
change the > to =
So the equation of the boundary line is
y = 3x
Now we find some points on this line.
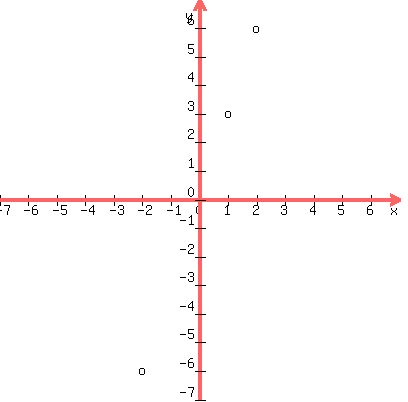
When x = 1, y = 3(1) = 3, so (1,3) is on the boundary line.
When x = -2, y = 3(-2) = -6, so (-2,-6) is on the boundary line
When x = 2, y = 3(2) = 6, so (2,6) is on the boundary line.
Plot those points:
 Now connect them with a dotted line. We draw it dotted because
the inequality is < rather than < which says the
boundary line is not included in the graph. If it were <
then we would have drawn the boundary line solid.
Now connect them with a dotted line. We draw it dotted because
the inequality is < rather than < which says the
boundary line is not included in the graph. If it were <
then we would have drawn the boundary line solid.
 Now we pick ANY arbitrary point which is NOT on the boundary line.
Say we arbitrarily pick the point, say, (2,1). This is called
the "test point". Different people will pick different test
points.
Now we pick ANY arbitrary point which is NOT on the boundary line.
Say we arbitrarily pick the point, say, (2,1). This is called
the "test point". Different people will pick different test
points.
 Go back to the original inequality, y < 3x, and substitute the x-value
of that test point for x, and the y-value of the test point for y:
y < 3x
1 < 3(2)
1 < 6
That is a TRUE equation, so we know to shade the SAME SIDE of the line
that the test point (2,1) is on. If it had turned out false, we would
have known to shade the other side. But as it is we shade the same side
the test point (2,1) is on, like this:
Go back to the original inequality, y < 3x, and substitute the x-value
of that test point for x, and the y-value of the test point for y:
y < 3x
1 < 3(2)
1 < 6
That is a TRUE equation, so we know to shade the SAME SIDE of the line
that the test point (2,1) is on. If it had turned out false, we would
have known to shade the other side. But as it is we shade the same side
the test point (2,1) is on, like this:
 Edwin
Edwin


 (
(