Question 89294: A small firm produces both AM and AM/FM car radios. The AM radios take 15 h
to produce, and the AM/FM radios take 20 h. The number of production hours is
limited to 300 h per week. The plant�s capacity is limited to a total of 18 radios per week, and existing orders require that at least 4 AM radios and at least 3 AM/FM radios be produced per week. Write a system of inequalities representing this situation. Then, draw a graph of the feasible region given these conditions, in which x is the number of AM radios and y the number of AM/FM radios.
Answer by jim_thompson5910(35256)   (Show Source): (Show Source):
You can put this solution on YOUR website! Let x=# of AM radios, y=# of AM/FM radios
Start with the given system of inequalities


In order to graph this system of inequalities, we need to graph each inequality one at a time.
First lets graph the first inequality
In order to graph , we need to graph the equation  (just replace the inequality sign with an equal sign). (just replace the inequality sign with an equal sign).
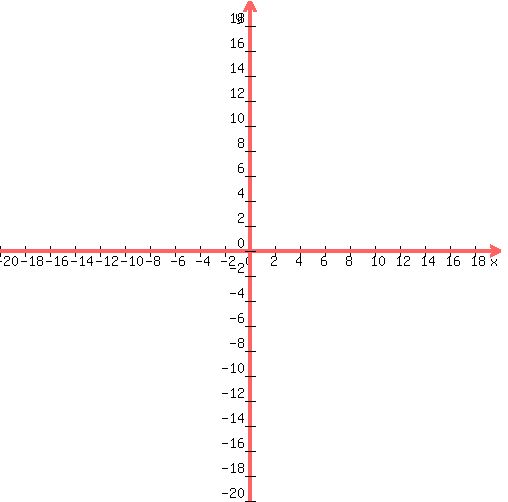
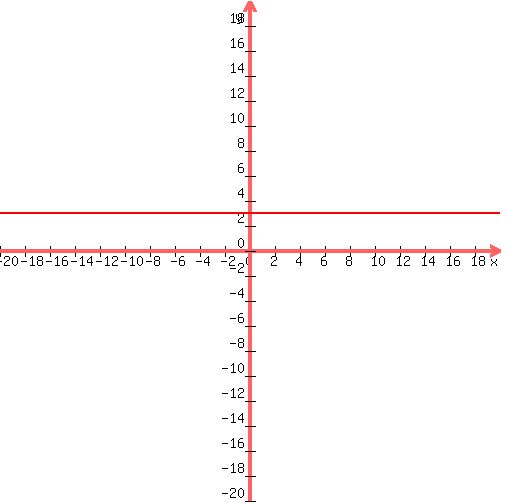
So lets graph the line (note: if you need help with graphing, check out this solver)
 graph of graph of
Now lets pick a test point, say (0,0). Any point will work, (just make sure the point doesn't lie on the line) but this point is the easiest to work with. Now evaluate the inequality with the test point
Substitute (0,0) into the inequality
 Plug in Plug in  and and 
 Simplify Simplify
Since this inequality is true, we simply shade the entire region that contains (0,0)
 Graph of with the boundary (which is the line in red) and the shaded region (in green) Graph of with the boundary (which is the line in red) and the shaded region (in green)
(note: since the inequality contains a less-than sign, this means the boundary is excluded. This means the solid red line is really a dashed line)
---------------------------------------------------------------
Now lets graph the second inequality
In order to graph , we need to graph the equation  (just replace the inequality sign with an equal sign). (just replace the inequality sign with an equal sign).
So lets graph the line (note: if you need help with graphing, check out this solver)
 graph of graph of
Now lets pick a test point, say (0,0). Any point will work, (just make sure the point doesn't lie on the line) but this point is the easiest to work with. Now evaluate the inequality with the test point
Substitute (0,0) into the inequality
 Plug in and Plug in and
 Simplify Simplify
Since this inequality is true, we simply shade the entire region that contains (0,0)
 Graph of with the boundary (which is the line in red) and the shaded region (in green) Graph of with the boundary (which is the line in red) and the shaded region (in green)
(note: since the inequality contains a less-than sign, this means the boundary is excluded. This means the solid red line is really a dashed line)
---------------------------------------------------------------
Now lets graph the third inequality
In order to graph , we need to graph the equation  (just replace the inequality sign with an equal sign). (just replace the inequality sign with an equal sign).
So lets graph the line (note: if you need help with graphing, check out this solver)
 graph of graph of
Now lets pick a test point, say (0,0). Any point will work, (just make sure the point doesn't lie on the line) but this point is the easiest to work with. Now evaluate the inequality with the test point
Substitute (0,0) into the inequality
 Plug in and Plug in and
 Simplify Simplify
Since this inequality is not true, we do not shade the entire region that contains (0,0). So this means we shade the region that is on the opposite side of the line
 Graph of with the boundary (which is the line in red) and the shaded region (in green) Graph of with the boundary (which is the line in red) and the shaded region (in green)
(note: since the inequality contains a greater-than sign, this means the boundary is excluded. This means the solid red line is really a dashed line)
---------------------------------------------------------------
Now lets graph the fourth inequality
In order to graph , we need to graph the equation  (just replace the inequality sign with an equal sign). (just replace the inequality sign with an equal sign).
So lets graph the line (note: if you need help with graphing, check out this solver)
 graph of graph of
Now lets pick a test point, say (0,1). Any point will work, (just make sure the point doesn't lie on the line) but this point is the easiest to work with. Now evaluate the inequality with the test point
Substitute (0,1) into the inequality
 Plug in and Plug in and 
 Simplify Simplify
Since this inequality is not true, we do not shade the entire region that contains (0,1). So this means we shade the region that is on the opposite side of the line
 Graph of with the boundary (which is the line in red) and the shaded region (in green) Graph of with the boundary (which is the line in red) and the shaded region (in green)
(note: since the inequality contains a greater-than sign, this means the boundary is excluded. This means the solid red line is really a dashed line)
---------------------------------------------------------------
So we essentially have these 4 regions:
Region #1
 Graph of Graph of
Region #2
 Graph of Graph of
Region #3
 Graph of Graph of
Region #4
 Graph of Graph of
When these inequalities are graphed on the same coordinate system, the regions overlap to produce this region. It's a little hard to see, but after evenly shading each region, the intersecting region will be the most shaded in. (note: for some reason, this image and the following image does not display in Internet Explorer. So I would recommend the use of Firefox to see these images.)

Here is a cleaner look at the intersection of regions
 Here is the intersection of the 4 regions represented by the series of dots Here is the intersection of the 4 regions represented by the series of dots
|
|
|