Question 878687: Graph the following systems of inequalities . Find the coordinates of any vertices formed.
x + y ≤ 16
3x + 6y ≥ 60
x ≥ 0
y ≥ 0
Can you please help me ? Thanks so much in advance:)
Answer by KMST(5328)   (Show Source): (Show Source):
You can put this solution on YOUR website!  just means the first quadrant, including the positive x- and y-axes. just means the first quadrant, including the positive x- and y-axes.
 means the line represented by means the line represented by  plus all the points to one side of that line. plus all the points to one side of that line.
Which side? The one with the origin, (0,0),
because substituting  into into
makes it true:  . .
 means the line represented by <---> means the line represented by <---> plus all the points to one side of that line. plus all the points to one side of that line.
Which side? The one without the origin, (0,0),
because substituting into
makes it not true:  . .
How can we graph the lines represented by
and  <---> <---> ? ?
These particular linear equations are easy to graph by finding their x- and y-intercepts.
For :
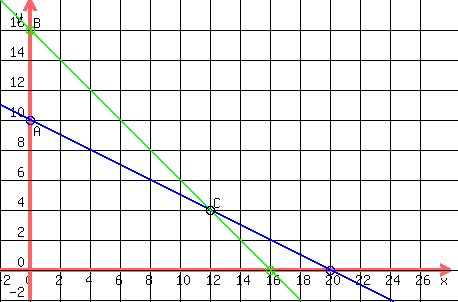
 --> --> gives us point (0,16). gives us point (0,16).
 --> --> gives us point (16,0). gives us point (16,0).
Those two points allow us to graph the line :

For <---> :
 --> --> gives us point (0,10). gives us point (0,10).
 --> --> gives us point (20,0). gives us point (20,0).
Those two points allow us to graph the line :

The region represented by 
is shown below as the triangle ABC.
|
|
|