Question 87280: Given the table:
x=-2,-1,0,1,2
y=.111,.333,1,3,9
Graph the function, identify the graph of the function (line, parabola, hyperbola or exponential), explain your choice, and give the domain and range as shouwn in the graph, and also the domain and range fo the entire function.
Graph:
Graph Type:
Explanation:
Domain:
Range:
Answer by rapaljer(4671)   (Show Source): (Show Source):
You can put this solution on YOUR website! x=-2,-1,0,1,2
y=.111,.333,1,3,9
Notice that  , ,  (approximately!), and that these and the other y values are ALL powers of 3. So it appears that (approximately!), and that these and the other y values are ALL powers of 3. So it appears that  . The graph is an exponential function, and the graph is . The graph is an exponential function, and the graph is
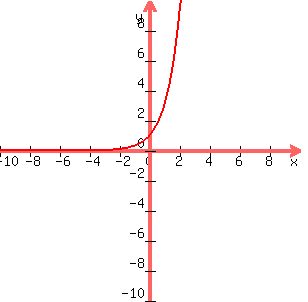
The domain is all real values of x, which is (-inf, inf).
The range is all values of y, such that y>0.
R^2 Retired from SCC
|
|
|