Question 87226This question is from textbook algebra structure and method
: We are suppose to solve then graph this problem and I'm not sure how to do that.
y>x+1
y<3/2x+3
Thanks for your help!
This question is from textbook algebra structure and method
Found 2 solutions by favegirl13, bucky:
Answer by favegirl13(22)   (Show Source): (Show Source):
You can put this solution on YOUR website! i think there's nothing to solve you just graph unless they are supposed to equal each which i believe their not
any ways
use a different colored pencil/pen for each equation so not to get confused
A) Draw your y axis and x axis. note that y axis is the vertical line and x axis is the horizontal line
B) lets start with the equation:
y>x+1
if it makes it easier change the greater than sign to an equal sign
y=x+1
plot your lines starting at (1,0)
since the slope is 1 over 1. go up one from (1,0) then to the the right one.
go up one then to the right each time.
connect the points
after plotting your points you still have shade in
y>x+1 shade in the top part of the line to represent the greater sign and the solutions of the equation.
C) the second equation is:
y<3/2x+3
on the same grid graph plot the point (3,0)
then from the point (3,0) go up 3 then to the right 2.
go up 3 and to the right 2 each time remember the line also goes to the negatives which is go down 3 then to the left 2
after connecting your points
shade under the line to represent the less than sign and the solutions to the equations
after shading the part of the shaded area that both colors(representing equations) overlap is the feasible region.
Hope this helps
Answer by bucky(2189) (Show Source): (Show Source):
You can put this solution on YOUR website! Given:
.
y>x+1 and y<3/2x+3
.
Problem: Solve and Graph
.
First y > x +1
.
Let's begin by treating this as an equality y = x +1. We will graph this. What can you tell
by looking at this equation. To begin with, this is a first degree equation (x has an
implied exponent of 1, not 2, 3, or ...). First degree equations have straight lines as
graphs. Next, note that this is in the slope-intercept form y = mx + b in which m (the multiplier
of x) is the slope of the graphed line (m = 1) and +1 is the point on the y-axis where the
graph crosses. Furthermore, you can graph the solutions of this equation by assuming a
couple of values for x and finding the corresponding values of y. For example, let x equal
zero. The equation then becomes y = 0 + 1 which simplifies to y = 1. So you know the point
(0,1) is on the graph. Next let x = -1. The equation becomes y = -1 + 1 = 0. So the point
(-1,0) is on the graph. Next let x = 2. The equation becomes y = 2 + 1 = 3. So the point
(2, 3) is also on the graph. You can continue this process and find a few more points.
Plot all the points and use a straight edge to draw a line through all the points you
have plotted. What does this line represent? It consists of all the points in which
y EQUALS x + 1. But the problem says that y must be GREATER than x + 1. Therefore,
any point that is above this graphed line has a y value that is greater than x + 1. The
way this is normally indicated is by graphing the line for the equation y = x + 1 and
then shading the area ABOVE the line (but not including the line itself). Any point in
the shaded are then has a y value that is more than the value of its corresponding
value of x plus 1. For example, if you let x = 5 then x + 1 is 6. So any point that has
an x value of 5 and a y value of greater than 6 satisfies y > x + 1. Examples of such
points are (5, 7), (5, 8), (5, 9), (5, 6.00001). If you plot these points you will see
that they are in the shaded area above the graph line for the equation y = x + 1.
.
Here's the graph:
.
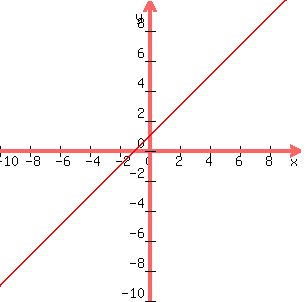
.
Imagine the shaded area above the line as the solution to this problem.
.
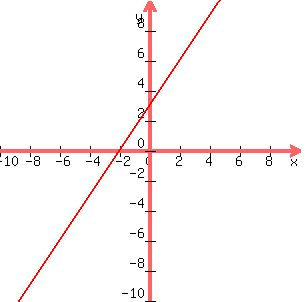
Next, let's work the problem:
.

.
Same approach as before. Change this to an equation:
.

.
Graph it. Your graph should look like this:
.
.
This time though since y is LESS than  the points having this property the points having this property
will be BELOW the line. Shade in the area below the line (do not include the line in
the shading).
.
Some points in the shaded area are (2, 5), (2, 4), (4, 8), (4, 6), (0, 2), (0, 0), (-2, -1),
(-2, -3). For each point, go to the given inequality, plug in the value for x and its
corresponding value for y. See if the inequality holds. That tells you that the point
satisfies the inequality. As an example, pick the point (2, 5). Plug 2 in for x and 5 in
for y in the inequality:
.
.
Substitution results in:
.

.
Multiply on the right side to get:
.

.
Note this inequality is true ... so (2, 5) is a point that satisfies the inequality
and also note that the point is in the shaded area.
.
One more point that does not apply to this problem ... if the inequality has an equal
sign as part of it, the graphed line IS INCLUDED in the shaded area. For example, if
the original inequality for the first problem had been:
.

.
the inclusion of the equal sign with the inequality sign would tell you that points on
the graphed line would be solutions also. Therefore, the line would need to be included
in the shaded region.
.
Hope this helps you ...
|
|
|