|
Question 86136: I need some help with these graph problems. I would appreciate some help with solving and graphing these systems. Thank you.
Solve the system by graphing.
x+y=4
-x+y=2
Solve the following systym of linear inequalities by graphing.
3x+4y<12
x+3y<6
x>0
y>0 (under each of the greater and lesser signs is a line)
Solve the following system of linear inequalities by graphing.
x+2y<3
2x-3y<6
Solve the following system of linear inequalities by graphing
x-2y>4
x<4
Thank you so much for taking your time to help me out. thanks alot.
Answer by jim_thompson5910(35256)   (Show Source): (Show Source):
You can put this solution on YOUR website!
| Solved by pluggable solver: Solve the System of Equations by Graphing |
Start with the given system of equations:


In order to graph these equations, we need to solve for y for each equation.
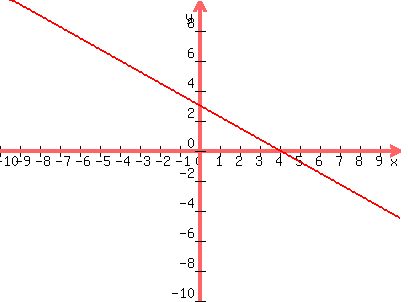
So let's solve for y on the first equation
Start with the given equation
 Subtract Subtract  from both sides from both sides
 Rearrange the equation Rearrange the equation
 Divide both sides by Divide both sides by 
 Break up the fraction Break up the fraction
 Reduce Reduce
Now lets graph (note: if you need help with graphing, check out this solver)
 Graph of Graph of
So let's solve for y on the second equation
Start with the given equation
 Add to both sides Add to both sides
 Rearrange the equation Rearrange the equation
 Divide both sides by Divide both sides by
 Break up the fraction Break up the fraction
 Reduce Reduce
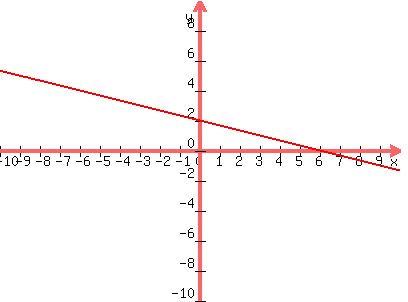
Now lets add the graph of to our first plot to get:
 Graph of (red) and (green) Graph of (red) and (green)
From the graph, we can see that the two lines intersect at the point (, ) (note: you might have to adjust the window to see the intersection) ) (note: you might have to adjust the window to see the intersection) |
--------------------------------------------------------------------------
Start with the given system of inequalities


In order to graph this system of inequalities, we need to graph each inequality one at a time.
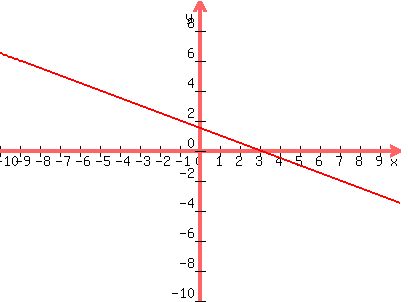
So lets graph the first inequality
In order to graph we need to graph the equation  (just replace the inequality sign with an equal sign). So lets graph the line (note: if you need help with graphing, check out this solver) (just replace the inequality sign with an equal sign). So lets graph the line (note: if you need help with graphing, check out this solver)
 graph of graph of
Now lets pick a test point, say (0,0) (any point will work, but this point is the easiest to work with), and evaluate the inequality
 Plug in x=0, y=0 Plug in x=0, y=0
 Simplify Simplify
Since this inequality is true, we shade the entire region containing (0,0)

Here is the graph of with the graph of the line() in red and the shaded region in green
(note: In this case, the red line is a solid line. This means the boundaries are included in the region.)
Now lets graph the second inequality
In order to graph we need to graph the equation  (just replace the inequality sign with an equal sign). So lets graph the line (note: if you need help with graphing, check out this solver) (just replace the inequality sign with an equal sign). So lets graph the line (note: if you need help with graphing, check out this solver)
 graph of graph of
Now lets pick a test point, say (0,0) (any point will work, but this point is the easiest to work with), and evaluate the inequality
 Plug in x=0, y=0 Plug in x=0, y=0
 Simplify Simplify
Since this inequality is true, we shade the entire region containing (0,0)

Here is the graph of with the graph of the line() in red and the shaded region in green
(note: In this case, the red line is a solid line. This means the boundaries are included in the region.)
Now lets graph the third inequality
In order to graph we need to graph the equation  (just replace the inequality sign with an equal sign). So lets graph the line (note: if you need help with graphing, check out this solver) (just replace the inequality sign with an equal sign). So lets graph the line (note: if you need help with graphing, check out this solver)
 graph of (it is the same line as the axis) graph of (it is the same line as the axis)
Now lets pick a test point, say (1,0) (any point will work, but this point is the easiest to work with), and evaluate the inequality
 Plug in x=1 Plug in x=1
 Simplify Simplify
Since this inequality is true, we shade the entire region that contain (1,0)

Here is the graph of with the graph of the line() in red and the shaded region in green
(note: In this case, the red line is a solid line. This means the boundaries are included in the region.)
Now lets graph the fourth inequality
In order to graph we need to graph the equation  (just replace the inequality sign with an equal sign). So lets graph the line (note: if you need help with graphing, check out this solver) (just replace the inequality sign with an equal sign). So lets graph the line (note: if you need help with graphing, check out this solver)
 graph of ((it is the same line as the axis) graph of ((it is the same line as the axis)
Now lets pick a test point, say (0,1) (any point will work, but this point is the easiest to work with), and evaluate the inequality
Plug in y=1
Simplify
Since this inequality is true, we shade the entire region that contain (0,1)

Here is the graph of with the graph of the line() in red and the shaded region in green
(note: In this case, the red line is a solid line. This means the boundaries are included in the region.)
So we essentially have these 4 regions
Region #1 which is the graph of
Region #2 which is the graph of
Region #3 which is the graph of
Region #4 which is the graph of
So these regions overlap to produce this region. It's a little hard to see, but after evenly shading each region, the intersecting region will be the most shaded in.

Here is a cleaner look at the intersection of regions
 Here is the intersection of the 4 regions represented by the dots Here is the intersection of the 4 regions represented by the dots
--------------------------------------------------------------------------
Start with the given system of inequalities


In order to graph this system of inequalities, we need to graph each inequality one at a time.
So lets graph the first inequality
In order to graph we need to graph the equation  (just replace the inequality sign with an equal sign). So lets graph the line (note: if you need help with graphing, check out this solver) (just replace the inequality sign with an equal sign). So lets graph the line (note: if you need help with graphing, check out this solver)
 graph of graph of
Now lets pick a test point, say (0,0) (any point will work, but this point is the easiest to work with), and evaluate the inequality
 Plug in x=0, y=0 Plug in x=0, y=0
 Simplify Simplify
Since this inequality is true, we shade the entire region containing (0,0)

Here is the graph of with the graph of the line() in red and the shaded region in green
(note: In this case, the red line is a solid line. This means the boundaries are included in the region.)
Now lets graph the second inequality
In order to graph we need to graph the equation  (just replace the inequality sign with an equal sign). So lets graph the line (note: if you need help with graphing, check out this solver) (just replace the inequality sign with an equal sign). So lets graph the line (note: if you need help with graphing, check out this solver)
 graph of graph of
Now lets pick a test point, say (0,0) (any point will work, but this point is the easiest to work with), and evaluate the inequality
 Plug in x=0, y=0 Plug in x=0, y=0
Simplify
Since this inequality is true, we shade the entire region containing (0,0)

Here is the graph of with the graph of the line() in red and the shaded region in green
(note: In this case, the red line is a solid line. This means the boundaries are included in the region.)
So we essentially have these 2 regions
Region #1 which is the graph of
Region #2 which is the graph of
So these regions overlap to produce this region. It's a little hard to see, but after evenly shading each region, the intersecting region will be the most shaded in.

Here is a cleaner look at the intersection of regions
 Here is the intersection of the 2 regions represented by the dots Here is the intersection of the 2 regions represented by the dots
--------------------------------------------------------------------------
Start with the given system of inequalities


In order to graph this system of inequalities, we need to graph each inequality one at a time.
So lets graph the first inequality
In order to graph we need to graph the equation  (just replace the inequality sign with an equal sign). So lets graph the line (note: if you need help with graphing, check out this solver) (just replace the inequality sign with an equal sign). So lets graph the line (note: if you need help with graphing, check out this solver)
 graph of graph of
Now lets pick a test point, say (0,0) (any point will work, but this point is the easiest to work with), and evaluate the inequality
 Plug in x=0, y=0 Plug in x=0, y=0
 Simplify Simplify
Since this inequality is not true, we shade the entire region that doesn't contain (0,0)

Here is the graph of with the graph of the line() in red and the shaded region in green
(note: In this case, the red line is a solid line. This means the boundaries are included in the region.)
Now lets graph the second inequality
In order to graph we need to graph the equation  (just replace the inequality sign with an equal sign). So lets graph the line (note: if you need help with graphing, check out this solver) (just replace the inequality sign with an equal sign). So lets graph the line (note: if you need help with graphing, check out this solver)
 graph of graph of
Now lets pick a test point, say (0,0) (any point will work, but this point is the easiest to work with), and evaluate the inequality
 Plug in x=0, y=0 Plug in x=0, y=0
 Simplify Simplify
Since this inequality is true, we shade the entire region containing (0,0)

Here is the graph of with the graph of the line() in red and the shaded region in green
(note: In this case, the red line is a solid line. This means the boundaries are included in the region.)
So we essentially have these 2 regions
Region #1 which is the graph of
Region #2 which is the graph of
So these regions overlap to produce this region. It's a little hard to see, but after evenly shading each region, the intersecting region will be the most shaded in.

Here is a cleaner look at the intersection of regions
 Here is the intersection of the 2 regions represented by the dots Here is the intersection of the 2 regions represented by the dots
|
|
|
| |