Question 844918: Graph f(x)=1+log base2 x
To graph the function, plot at least two points on the graph, draw all asymptotes
Answer by Theo(13342)   (Show Source): (Show Source):
You can put this solution on YOUR website! the easiest thing to do is have software do it for you.
if you want to do it manually, you would need to set up some parameters.
for one, x can't be 0 and it can't be negative since the number that you take the log of has to be a positive number.
the log function can be graphed directly, or you can convert it to its equivalent exponential function and graph that.
in order to graph it directly, you would need to have access to a calculator that will give you log2(x).
most calculators can't do that directly but can do it by using the following log base conversion formula.
log2(x) = log10(x)/log10(2).
since log10 is the LOG key on the calculator, you would enter in your calculator as follows:
LOG(x)/LOG(2).
For example, to find log2(1), you would enter LOG(1)/LOG(2) in your calculator.
For another example, to find log2(5), you would enter LOG(5)/LOG(2) in your calculator.
the basic definition of logs is:
logb(x) = y if and only if b^y = x
see this reference for the basic definition of logs and the 4 basic properties of those logs:
http://www.andrews.edu/~calkins/math/webtexts/numb17.htm
if you don't have a calculator handy and want to do it manually, then converting the log equation to its equivalent exponential form would be a good way to go.
your equation is:
f(x) = 1 + log2(x)
replace f(x) with y and the equation becomes:
y = 1 + log2(x)
subtract 1 from both sides of the equation and your equation becomes:
y-1 = log2(x)
by the definition of logarithms, you can convert this to it's exponential form to get:
y-1 = log2(x) if and only if 2^(y-1) = x
now you would graph x = 2^(y-1) rather than y = 1 + log2(x)
The graphs will be identical as you can see below:
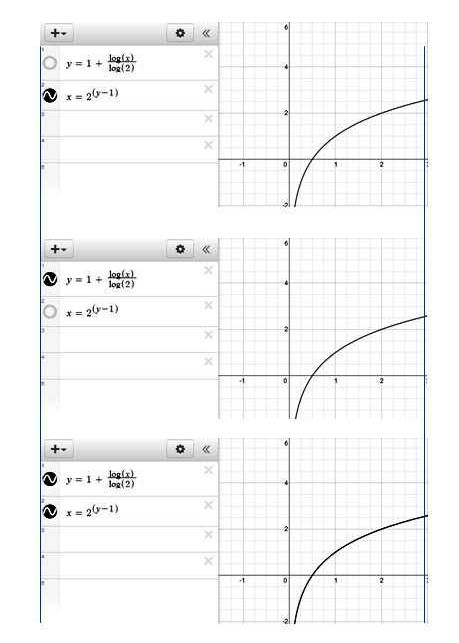
the top and middle graph show each equation separately.
the bottom graph shows both equations at the same time.
that bottom graph proves conclusively that you are looking at graphs of equations that are equivalent to each other.
note that log2(x) is shown as log(x) / log(2).
that's the conversion formula i showed you earlier doing it's thing by allowing the graphing software to model log2 even though it can only model log10.
to graph this manually, without access to log tables or calculators, you would use the basic definition of logs to convert it to its equivalent exponential form and you would then set up a table using the exponential form.
a sample table that could have been created is shown below:
     x            y
   1/32           -4
   1/16           -3
   1/8            -2
   1/4            -1
   1/2             0
   1               1
   2               2
   4               3
   8               4
in creating this table, i picked the value of y that i wanted and then calculated the resulting value of x based on the equation of x = 2^(y-1).
now you would create your graph manually by plotting the following points on the graph.
(x,y)
----------
(1/32, -4)
(1/16, -3)
(1/8, -2)
(1/4, -1)
(1/2, 0)
(1,1)
(2,2)
(4,3)
(8,4)
i verified with a graphing calculator that i used to graph y = 1 + log2(x), that those points are correct and, if you use those points, you will get the graph that you want.
|
|
|