|
Question 83198: Hello out there,I'm writing for some help with some slope-intercept problems,the first one is,Are the following two graphs in a family?If so/explain why,y=3x-2 and y=-2x+1.The next one is,Are the following two graphs in a family?If so explain why,y=-2x+3 and y=2x+3.The next one is,Change y=x-3 so that the graph of the new equation has a steeper,negative slope the same y-intercept.And the last one is,Write the point-slope form of the line that passes through (3,-3)and(5,1),thanks for whoever can help.
Answer by jim_thompson5910(35256)   (Show Source): (Show Source):
You can put this solution on YOUR website! If you graph  you get you get
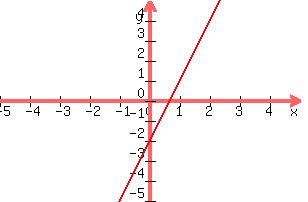
If you graph  you get you get

Since neither of these graphs share the same slope or y-intercept, they are not in a family (ie they have nothing in common).
---------------------------------------------------------------------------
If you graph  you get you get

and if you graph  you get you get
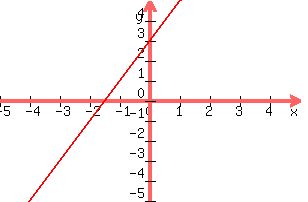
You will notice that these two graphs have the same y-intercept, so they belong in a family (since they share the same y-intercept).
--------------------------------------------------------------------------
If you have  and you want a steeper, negative slope, simply make the slope a large negative value (for the general slope-intercept equation and you want a steeper, negative slope, simply make the slope a large negative value (for the general slope-intercept equation  , m is the slope) . So I could choose -7, and that would make a steep, negative slope. So if I graphed , m is the slope) . So I could choose -7, and that would make a steep, negative slope. So if I graphed  I would get I would get

---------------------------------------------------------------------------
| Solved by pluggable solver: Finding the Equation of a Line |
First lets find the slope through the points ( , , ) and ( ) and ( , , ) )
 Start with the slope formula (note: ( Start with the slope formula (note: ( , , ) is the first point (,) and ( ) is the first point (,) and ( , , ) is the second point (,)) ) is the second point (,))
 Plug in Plug in  , , , , , , (these are the coordinates of given points) (these are the coordinates of given points)
 Subtract the terms in the numerator Subtract the terms in the numerator  to get to get  . Subtract the terms in the denominator . Subtract the terms in the denominator  to get to get 
 Reduce Reduce
So the slope is
------------------------------------------------
Now let's use the point-slope formula to find the equation of the line:
------Point-Slope Formula------
 where where  is the slope, and (,) is one of the given points is the slope, and (,) is one of the given points
So lets use the Point-Slope Formula to find the equation of the line
 Plug in , , and (these values are given) Plug in , , and (these values are given)
 Rewrite Rewrite  as as 
 Distribute Distribute
 Multiply and to get Multiply and to get  . Now reduce to get . Now reduce to get 
 Subtract from both sides to isolate y Subtract from both sides to isolate y
 Combine like terms and to get Combine like terms and to get 
------------------------------------------------------------------------------------------------------------
Answer:
So the equation of the line which goes through the points (,) and (,) is:
The equation is now in form (which is slope-intercept form) where the slope is and the y-intercept is 
Notice if we graph the equation and plot the points (,) and (,), we get this: (note: if you need help with graphing, check out this solver)
 Graph of through the points (,) and (,) Graph of through the points (,) and (,)
Notice how the two points lie on the line. This graphically verifies our answer.
|
|
|
|
| |