Question 805565: Find the range of values of x for which f(x)>h(x)>g(x)and x<3
f(x) = {x-3/2}
g(x) = x+17/18
h(x) = -x^2+6x+7
The brackets {} are supposed to stand for modulus but I can't write this on my computer.
I am not sure how to approach this question.
Could you please help?
Thank you.
Answer by KMST(5328)   (Show Source): (Show Source):
You can put this solution on YOUR website! You could write f(x) = abs(x-3/2) for  . .
Internationally, I believe the most popular name for "modulus" is "absolute value", and people and computers usually understand "abs(X)" to mean  . .
One way to solve the problem would be to split the problem into two inequality problems,
one for  and the other for and the other for  , ,
and then work very hard at solving inequalities,
but I do not think that is what's intended.
I think the problem is intended to test knowledge of graphing functions, including linear and quadratic functions.
With a little thinking and visualizing,
the problem gets reduced to finding where  for for  , ,
where  and and  can be simplified to can be simplified to  . .
THINKING AND VISUALIZING:
Let's think of the shape of the graphs.
graphs as a V-shaped curve with a vertex at 
and arms sloping up at  from the horizontal on both sides from the horizontal on both sides
(slopes are -1 for the left arm , and 1 for the right arm).
It passes through point  , its y-intercept. , its y-intercept.
 graphs as a straight line, with slope 1. graphs as a straight line, with slope 1.
The line obviously goes through  , the x-intercept, , the x-intercept,
and through  , the y-intercept. , the y-intercept.
Those two curves would look like this:

To the right of ,  and graph as straight parallel lines with slope 1, so they only cross at one point. We can calculate the coordinates of that point, but we do not need to. and graph as straight parallel lines with slope 1, so they only cross at one point. We can calculate the coordinates of that point, but we do not need to.
 is a quadratic function, so it graphs as a parabola. is a quadratic function, so it graphs as a parabola.
Sketching that graph would help you visualize the problem and see where it could be below the lines that are the graphs of the other two functions.
I know that it looks like this:

The solution makes me think that you are expected to use a graphing calculator.
You can get the graphs from a graphing calculator, or a computer with the right software.
They would even give you approximate values for the coordinates of all the intersection points,
where the graphs cross one another, and where they cross the axes.
That makes finding an approximate solution very easy.
It is convenient to know how to use technology, and to be able to use it,
but it would be nice to also know the shape of the curves, and how to solve problems without that help.
SOLVING:
You are looking at solutions for ,
where  . .
It is easy to see that, for ,  . .
You need to find where the value for  is in between and is in between and  . .
You just need to find where for , the graph for intersects the graphs of and .
The solution will be all the x values between those two intersections.


 is the negative solution. is the negative solution.
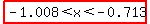
It's approximately  , as the graphing calculator could tell you. , as the graphing calculator could tell you.


 is the negative solution. is the negative solution.
It's approximately  . .
The solution is 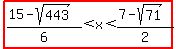 as an exact solution. as an exact solution.
The approximate solution that you can get from a graphing calculator could be expressed as
NOTE (KNOWING ABOUT QUADRATIC FUNCTIONS, SKETCHING, VISUALIZING):
In  , there is minus sign in front of , there is minus sign in front of 
(the leading coefficient is  ), ),
and that means that has a maximum,
and that the graph is shaped sort of like an inverted U.
The maximum for a quadratic represented by  is at is at  , ,
so in this case it is at  : :

The y-intercept at  is is  , so between and , so between and
is increasing from  to a greater value a the maximum, to a greater value a the maximum,  . .
At , and for values of x between 0 and 3,  and certainly and certainly  , so there are no solutions for , so there are no solutions for 
From to the left, for ,  , ,
and at some point it will be zero,
and to the left of that it will be negative.
For more points to help you sketch the graph, you can think of as

If you like to factor polynomials and solve quadratic equations by factoring,
that would tell you that  (meaning the graph crosses the x-axis) at (meaning the graph crosses the x-axis) at  and and  . .
|
|
|