Question 802495: I'm trying to help my stepson with his math. It is graphing. The question is y= -2x+7. I'm not sure how to graph this. Could you show me the steps to solving this problem ? Thank you
Answer by KMST(5328)   (Show Source): (Show Source):
You can put this solution on YOUR website! Linear equations, such as  graph as straight lines. graph as straight lines.
To graph the line, you just need to determine two points and connect them with a straight line.
However, some teachers may insist on having more points.
They may like their work shown in a certain way, maybe with a table of x and y values.
Your stepson may know if the teacher has some special requirements.
It is a good idea to use grid paper, or graph paper.
You can but the paper, or you can download and print some nice graphing papers.
I used to print those for my children (now in college and beyond).
I will show you how to calculate a few points, put them on a table, plot the points, and draw the line.
(The teacher may prefer a different style, but I hope this helps.
For  , ,  --> -->  --> --> 
That gives you the point (0,7), with and .
(That point and the value for  , ,  are often called the y-intercept, because it is the point where the line crosses the y-axis). are often called the y-intercept, because it is the point where the line crosses the y-axis).
For  , ,  --> -->  --> --> 
That gives you the point (3,13), with and .
For  , ,  --> -->  --> --> 
That gives you the point (-5,-3), with and .
A table with just those 3 points would look like this:

(I made the table horizontal with the x values on the top row, and the corresponding y value below each x value. The teacher may want the table vertical with the x values on the left column, and the y values in another column, each y to the right of the corresponding x).
The graph would look like this:
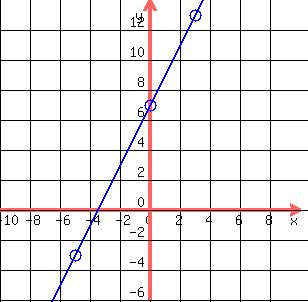
NOTES:
I made rather big circles around the points (-5,3), (0,7), and (3,13) to make them more visible.
The teacher may like less obvious markings or no visible marking at all.
Not having graph paper, or grid paper, I drew a grid the best way I could do it. Unfortunately, my grid lines do not go through the points calculated, but if I were the teacher, this would be an acceptable graph.
|
|
|