|
Question 785318: Find a linear equation whose graph is the straight line with the given properties.
Through
(23, −5.1)
and increasing at a rate of 15 units of y per unit of x.
Answer by MathLover1(20850)   (Show Source): (Show Source):
You can put this solution on YOUR website! If the value of  changes by changes by  units when the value of units when the value of  changes by changes by  , ,
then the slope of that line is 
and if line goes through ( , , ), then equation will be: ), then equation will be:
| Solved by pluggable solver: FIND a line by slope and one point |
What we know about the line whose equation we are trying to find out:
- it goes through point (23, -5.1)
- it has a slope of 15
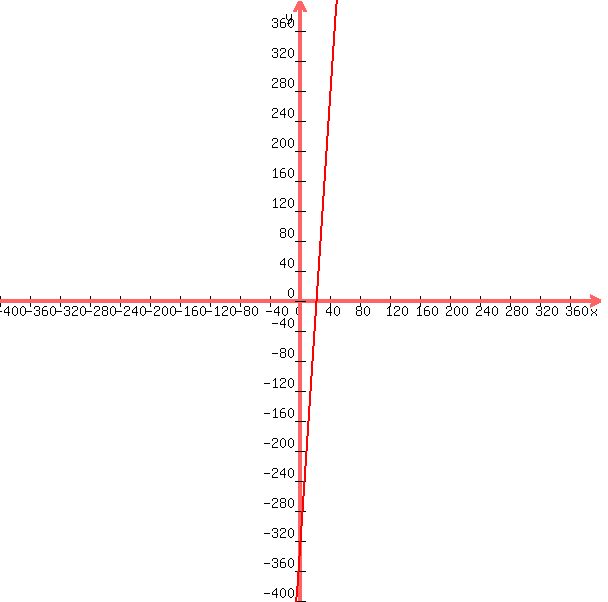
First, let's draw a diagram of the coordinate system with point (23, -5.1) plotted with a little blue dot:

Write this down: the formula for the equation, given point  and intercept a, is and intercept a, is
 (see a paragraph below explaining why this formula is correct) (see a paragraph below explaining why this formula is correct)
Given that a=15, and  , we have the equation of the line: , we have the equation of the line:

Explanation: Why did we use formula  ? Explanation goes here. We are trying to find equation y=ax+b. The value of slope (a) is already given to us. We need to find b. If a point ( ? Explanation goes here. We are trying to find equation y=ax+b. The value of slope (a) is already given to us. We need to find b. If a point ( , ,  ) lies on the line, it means that it satisfies the equation of the line. So, our equation holds for (, ): ) lies on the line, it means that it satisfies the equation of the line. So, our equation holds for (, ):  Here, we know a, , and , and do not know b. It is easy to find out: Here, we know a, , and , and do not know b. It is easy to find out:  . So, then, the equation of the line is: . So, then, the equation of the line is:  . .
Here's the graph:

|
since you cannot see a line on a graph above, here is another graph:
|
|
|
| |