Question 78255: hi i am having trouble working out how to do these graphs.
could someone show me how to work it out and if they could do the graphs that would be much appreciated x
Question:
plot a graph of the following curves and write down their co-ordinates of their intersection with the x- axis:
a, y=x�-x-2
b, y=2x�-3x-9
plot the graphs between x=-2 and x=+3
thanks for your help x
Answer by jim_thompson5910(35256)   (Show Source): (Show Source):
You can put this solution on YOUR website! In order to graph  lets make a table: lets make a table:
      x      y
   -5.0   28.0
   -4.0   18.0
   -3.0   10.0
   -2.0    4.0
   -1.0    0.0
    0.0   -2.0
    1.0   -2.0
    2.0    0.0
    3.0    4.0
    4.0   10.0
    5.0   18.0
Now draw a parabola through these points

In order to graph  lets make a table: lets make a table:
     x      y
   -5.0   56.0
   -4.0   35.0
   -3.0   18.0
   -2.0    5.0
   -1.0   -4.0
    0.0   -9.0
    1.0  -10.0
    2.0   -7.0
    3.0    0.0
    4.0   11.0
    5.0   26.0
Now draw a parabola through these points

So now use the quadratic formula for each case to find the x-intercepts
| Solved by pluggable solver: SOLVE quadratic equation with variable |
Quadratic equation  (in our case (in our case  ) has the following solutons: ) has the following solutons:

For these solutions to exist, the discriminant  should not be a negative number. should not be a negative number.
First, we need to compute the discriminant :  . .
Discriminant d=9 is greater than zero. That means that there are two solutions:  . .


Quadratic expression  can be factored: can be factored:

Again, the answer is: 2, -1.
Here's your graph:
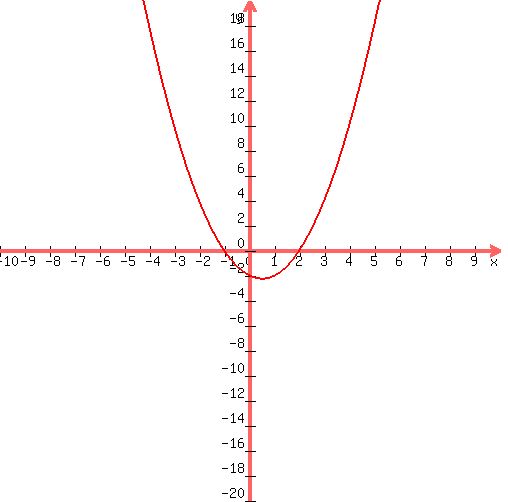 |
So the x-intercepts are (-1,0) and (2,0)
| Solved by pluggable solver: SOLVE quadratic equation with variable |
Quadratic equation (in our case  ) has the following solutons: ) has the following solutons:
For these solutions to exist, the discriminant should not be a negative number.
First, we need to compute the discriminant :  . .
Discriminant d=81 is greater than zero. That means that there are two solutions:  . .


Quadratic expression 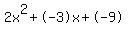 can be factored: can be factored:

Again, the answer is: 3, -1.5.
Here's your graph:
 |
So the x-intercepts are (-1.5,0) and (3,0)
|
|
|