You can
put this solution on YOUR website! First make a table
          x          y
   -5.00000  -75.00000
   -4.00000  -48.00000
   -3.00000  -27.00000
   -2.00000  -12.00000
   -1.00000   -3.00000
    0.00000    0.00000
    1.00000   -3.00000
    2.00000  -12.00000
    3.00000  -27.00000
    4.00000  -48.00000
    5.00000  -75.00000
Now plot each point and draw a parabola through them
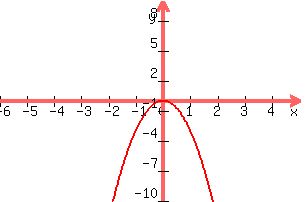 graph of
Note: Winplot is a great program that will allow you to graph if you don't have a graphing calculator.
From this we can see that the domain is all real numbers, and the range is y<0


 (
(