Question 760908: I need help with Graphing lines, I have 2x-4y=12
I have a chart that has X -2, -1,0, 1, 2, and Y is blank. I don't understand how to answer it or what to do.
Answer by lwsshak3(11628)   (Show Source): (Show Source):
You can put this solution on YOUR website! I need help with Graphing lines, I have 2x-4y=12
***
The first step is to rewrite equation in terms of y and in standard form for a straight line.
2x-4y=12
4y=2x-12
y=x/2-3
This is an equation of a straight line whose standard form is: y=mx+b. m=slope, b=y-intercept
From here, you can plug in several different values of x to get points for the graph.
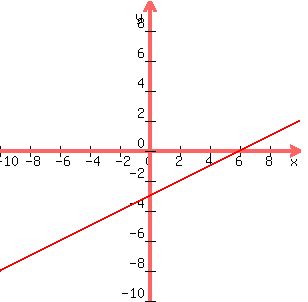
A better and more efficient way is find the y-intercept which=3 in this case, and use the slope=1/2 in this case to get a 2nd point. From the y-intercept, move 2 units to the right and one unit up to get the 2nd point. Run the line thru these two points for the graph. Plug in an x-value as a check to see if it falls on the line as it should.
note: slope=rise/run=∆y/∆x
see graph below as a visual check:
|
|
|