Question 748748: How do you graph the inequality y < |x|+ 5?
Answer by tommyt3rd(5050)   (Show Source): (Show Source):
You can put this solution on YOUR website! Absolute value is the distance from 0 so it is always positive. It is also a line with a slope of 1 (or -1 for negative numbers).
If we add 5 after we take the absolute value of x, then the graph is shifted vertically upward by 5 units.
Then we test a point, say (0,0), to see if it makes our inequality true:
0< Abs(0)+5 which is true so we shade below the graph (but I don't know how to do the shading on the graph)
Notice the table:
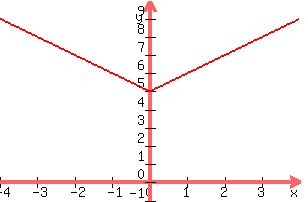
x, y=abs(x)+5
-3, 8
-2, 7
-1, 6
0, 5
1, 6
2, 7
3, 8
Here is the graph:
:)
|
|
|