|
Question 74235: graph
a) by finding the x- and y-intercept : x-3y=-6
b)by using the slope and y-intercept : x-4y=8
Found 2 solutions by checkley75, rmromero:
Answer by checkley75(3666)   (Show Source): (Show Source):
You can put this solution on YOUR website! X-3Y=-6,-3Y=-X-6,Y=-X/-3-6/-3,Y=X/3+2 THUS THE Y INTERCEPT IS 2.
NOW WE SET Y=0 & SOLVE FOR X
0=X/3+2
X/3=-2
X=-6 SO THE 2 INTERCEPTS ARE (0,2)&(-6,0) [red line]
-------------------------------------------------------------------
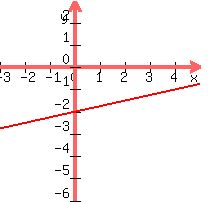
X-4Y=8,-4Y=-X+8,Y=-X/-4+8/-4,Y=X/4-2 THUS THE SLOPE IS 1/4 & THE Y INTERCEPT IS -2 [green line]
------------------------------------------------------------------
 (graph 300x200 pixels, x from -10 to 10, y from -10 to 10, of TWO functions y = x/3 +2 and y = x/4 -2). (graph 300x200 pixels, x from -10 to 10, y from -10 to 10, of TWO functions y = x/3 +2 and y = x/4 -2).
Answer by rmromero(383) (Show Source): (Show Source):
You can put this solution on YOUR website!
graph

a) by finding the x- and y-intercept : x-3y=-6


Two points determine a line.WE need two points then.

The x-intercept and the y-intercept

To find x-intercept , y = 0. Substitute it to x-3y=-6


             x - 3(0) = -6

                    x = -6

First point is located (-6,0)


To find y -intercept, x = 0.Substitute it to x-3y=-6


              0 - 3y = -6

                 -3y = -6

                   y = 2


second point is located (0, 2)


graphing time


b)by using the slope and y-intercept : x-4y=8


Slope - intercept form is y = mx + b, where m = slope and b = y-intercept


we will rewrite the given equation to slope - intercept form


                  x - 8 = 4y


                  x     8

                 ___ - ___  = y

                  4     4


                  1

                 ___x - 2  = y

                  4


m = 1/4 and b = -2


 The first point is located using b which is the y - intercept (0,-2)


Using the y -intercept, the slope help us locate the next point

The numerator represents the change in y and denominator the change in x


from (0,-2) we move 1 unit up (up for positive)

 and 4 unit right (right for positive)
|
|
|
| |