Question 73872: ) For a fixed rate, a fixed principal amount, and a fixed compounding cycle, the return is an exponential function of time. Using the formula, A=P(1+r/n)^nt , let r = 10%, P = 1, and n = 1 and give the coordinates (t, A) for the points where t = 0, 1, 2, 3, 4. Round your answer to the hundredth's place.
a) Show coordinates in this space
Show work in this space
b) Show graph here
Answer by bucky(2189)   (Show Source): (Show Source):
You can put this solution on YOUR website! When you make the substitutions of values given in the problem, the equation becomes:
.

.
When you do the math this further reduces to:
.

.
Now all you have to do is to substitute (one at a time) for t the following values:
0, 1, 2, 3, 4.
.
The first substitution is easy because any number raised to the 0 power is 1. So
.

.
And the next substitution is just as easy because any number raised to the 1 power is
just itself.
.

.
The next one is not too bad because 
.
The rest is quick work on a calculator to get  and and 
.
So the points to plot are:
.
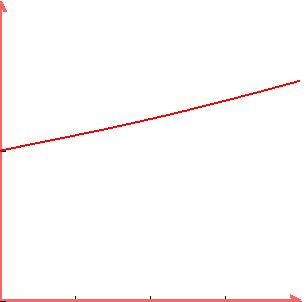
(0,1) (1,1.1) (2,1.21) (3,1.33) and (4,1.46)
.
When you plot these points the graph should look like:
.
.
Note that the graph is NOT a straight line. It is the beginning of an exponential
curve whose rise gets much steeper as t gets larger and larger.
.
You now have the points, the work, and a view of the graph. That should help you with the
problem and understanding it better.
|
|
|