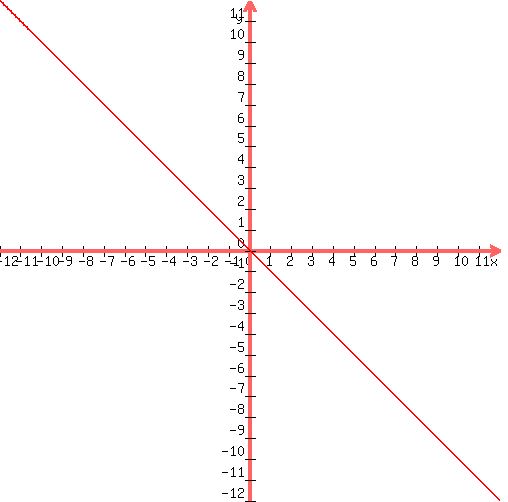
Question 736459: I am so lost can you please help? I need to solve and graph y=-x
Found 2 solutions by Alan3354, josmiceli:
Answer by Alan3354(69443)   (Show Source): (Show Source):
You can put this solution on YOUR website! Same as this one:
------------
solve and graph y=x-2
================
It is solved for y.
You can solve for x: x = y+2
--------------
It's 1 equation in 2 variables, --> an infinite # of solutions.
y = x-2
You can pick any number for x and find y.
----
To graph it, you need 2 points.
Pick 2 values for x and find y.
x = 0, y = -2 --> point (0,-2)
x = 2, y = 0 --> point (2,0)
x = 100, y = 98 --> (100,98)
------
Plot at least 2 points, draw a line thru them.
Every point on the line is a "solution."
Answer by josmiceli(19441)  (Show Source): (Show Source):
You can put this solution on YOUR website! Make a chart that has columns labeled  and and 
Under the column, you will pick values that are
pretty close to  , like: , like:
-10, -9, -8, -7, -6, -5, -4, -3, -2, -1, 0, 1, 2, 3, 4, 5, 6, 7, 8, 9, 10
( remember: write these vertically )
Now alongside each of these values for , you will fill in a
value for


-------------


-----------
etc.
When you get to  , ,


-----------

----------

----------
etc.
After you have filled the chart, each pair of ( x,y )
entries is a point that you will plot, so you
have the points:
( -10, 10 )
( -9, 9 ),
( -8, 8 ),
etc.
For plotting, the origin is (0,0) and positive x is to the right,
negative x is to the left, positive y is up, and
negative y is down.
You will end up with the following plot:
You can plot any equation with this method
|
|
|