Question 72923: 3)
x -2 -1 0 1 2
y .25 .5 1 2 4
Given the table above, graph the function, identify the graph of the function (line, parabola, hyperbola, or exponential), explain your choice, and give the domain and range as shown in the graph, and also the domain and range of the entire function.
Graph
Graph Type
Explanation
Domain
Range
Answer by Edwin McCravy(20054)   (Show Source): (Show Source):
You can put this solution on YOUR website!
x -2 -1 0 1 2
y .25 .5 1 2 4
Given the table above, graph the function,
identify the graph of the function (line,
parabola, hyperbola, or exponential),
explain your choice, and give the domain
and range as shown in the graph, and also
the domain and range of the entire function.
Graph
Graph Type
Explanation
Domain
Range
Plot those points, connect them with a smooth
curve and get this:
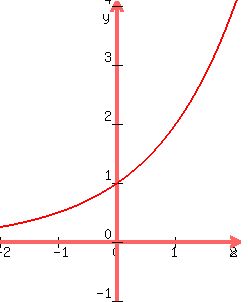 That graph looks like an exponential function,
because an exponential function has the x-axis
as its horizontal asymptote on the left and it
passes through y-intercept (0,1) and "sky-rockets"
thereafter on the right.
Its domain is (-Ą,Ą) because the curve projects
downward onto the entire x-axis.
Its range is (0,Ą) because the entire curve
projects right and left onto only the top half
of the y-axis, (0,Ą)
BTW its equation is y = 2x. If you need to know
this and why, post again.
Edwin
That graph looks like an exponential function,
because an exponential function has the x-axis
as its horizontal asymptote on the left and it
passes through y-intercept (0,1) and "sky-rockets"
thereafter on the right.
Its domain is (-Ą,Ą) because the curve projects
downward onto the entire x-axis.
Its range is (0,Ą) because the entire curve
projects right and left onto only the top half
of the y-axis, (0,Ą)
BTW its equation is y = 2x. If you need to know
this and why, post again.
Edwin
|
|
|