|
Question 72714: I have a question.
I have to graph this equation using the slope and y-intercept, y=x-2 and don't get how to do it.
Answer by bucky(2189)   (Show Source): (Show Source):
You can put this solution on YOUR website! You are given the equation y = x - 2 and are asked to graph it using the slope and the y intercept.
.
The equation you are given is in the slope-intercept form. The slope-intercept form is:
.
y = mx + b
.
where m is the slope and b is the value on the y-axis where the graph crosses.
.
Compare the slope intercept form to the given equation. You can see that b = -2 so the
graph crosses the y-axis at -2. And you can see that the slope m is the multiplier of
x and the multiplier of x is +1 (it doesn't show because we don't usually write a multiplier
of 1).
.
What does a slope of +1 mean? It means that for every 1 unit you go horizontally to the
right from the graph, you go vertically up 1 unit in the +y direction. So in this problem,
if you put your pencil on the y-axis intercept (where y = -2) and move your pencil 1 horizontal
unit to the right, stop there, then move your pencil 1 unit up, your pencil is now at
another point on the graph. Or if this isn't enough of a difference on the graph,
start at the point -2 on the y-axis, move your pencil 5 horizontal units to the right, then
move your pencil vertically up from that spot a total of 5 units and mark that end spot.
This gives you another point on the graph. (At this point you should be at x = +5 and y = +3
or in other words (5,3). This point plus the y-intercept determines the graph and you
can lay a straight edge along these two points and draw the graph as a line running through
the two points.
.
Another way you can do it is to go to the given equation and get points by assigning
values to x and calculating the corresponding values of y. Then you plot the points that
result and connect all the points using a straight line. Again we know that -2 on the y-axis
is one point on the graph. Use the equation:
.
y = x - 2
.
Let's say that x = 3. Substitute that value into the equation and you get:
.
y = 3 - 2 = 1
.
So we have another point (3, 1) [which says when x = 3 the corresponding value of y is 1].
Plot the point (3, 1) and this gives you another point on the graph. And you can pick
other values of x and calculate the corresponding values of y. Then plot the points and
see that they should also be on the graph. It's a good idea to get at least 3 points plotted --
two to determine the line and another 1 to serve as a check. If all 3 points don't line
up, then one or more of the points is wrong.
.
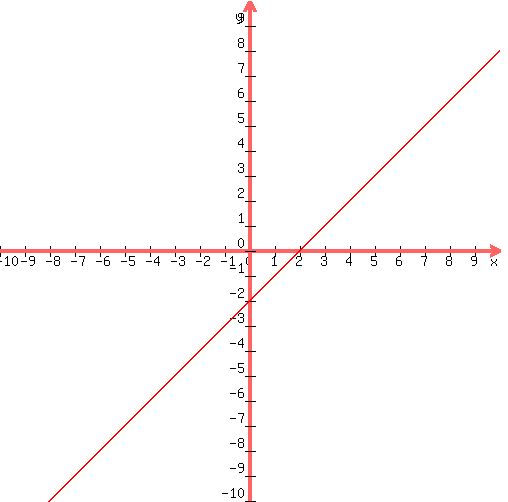
Incidentally, the graph for this problem is shown below and you can use it as a check for your
work.
.
Hope this helps you understand the slope intercept method of graphing a little better.
.
.
|
|
|
| |