Question 704873: How do I graph y=3/5 x-2 I know how to graph but not 3/5
Found 2 solutions by checkley79, KMST:
Answer by checkley79(3341)   (Show Source): (Show Source):
Answer by KMST(5328)  (Show Source): (Show Source):
You can put this solution on YOUR website! ONE WAY TO DO IT:
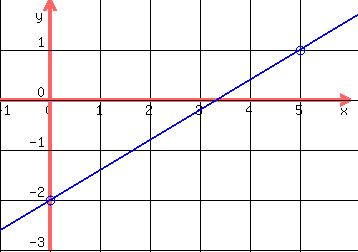
To graph a linear equation you just need 2 points.
You can calculate the y-coordinate for 2 values of x,
plot the points, and connect them with a line.
I could pick  and and  . .
For  --> -->  gives point (0,-2) gives point (0,-2)
For  --> -->  --> -->  gives point (5,1) gives point (5,1)
ANOTHER WAY:
You may be used to equations like y=2x+1,
where you knew the y-intercept is 1,
and that gave you the point with y=1 on the y-axis (where x=0).
Then you would notice that the slope is 2,
and would plot points for x=1, x=2, x=3, increasing the y-coordinate by 2 each time.
Slopes can be positive, or negative; they can be fractions too.
A slope of  means that for a "run" of means that for a "run" of  (as x increases by 5) (as x increases by 5)
the "rise" is  (the change in y is 3, y increases/rises by 3). (the change in y is 3, y increases/rises by 3).
So for  , ,
from the point you would mark with y=-2 on the y-axis,
you move 5 units to the right and 3 units up top mark the next point.
Then you can repeat the same moves to mark more points,
and you can reverse them (5 left, 3 down) to go in the other direction.

|
|
|