Question 704458: Use the slope and y-intercept to graph the linear function.
y = -6x ( can you tell me where I would need to graph the line) I can't figure out how to make a graph on here, so if you have a link or something to show me how to write this on a graph I would appreciate it.
Found 2 solutions by stanbon, Alan3354:
Answer by stanbon(75887)   (Show Source): (Show Source):
You can put this solution on YOUR website! Use the slope and y-intercept to graph the linear function.
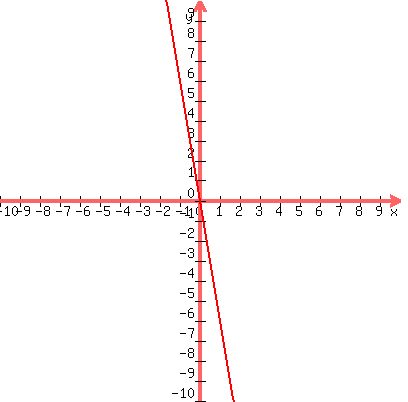
y = -6x
-----------------------
slope = -6
y-intercept = 0
-------
Plot a point at (0,0).
Let x = 2, then y = -12
Plot the point (2,-12)
---
Draw a line thru the two points you plotted.
------------------------
Cheers,
Stan H.
========================
Answer by Alan3354(69443)  (Show Source): (Show Source):
You can put this solution on YOUR website! Use the slope and y-intercept to graph the linear function.
y = -6x
------------------
The y-intercept is zero, the Origin (0,0).
y = -6x + 0 in slope-int form.
----------------------
(0,0) is one point.
For each increase in x of 1, y changes -6
On the x-y plane, count 1 to the right and 6 down for the 2nd point.
Draw a line thru them.
|
|
|