Question 698071: inequalities in two variables
graph on a coordinate plane
step by step
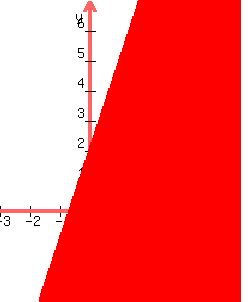
y<3x+2
Answer by KMST(5328)   (Show Source): (Show Source):
You can put this solution on YOUR website! First, you draw the boundary line.
That is the line 
When the line itself is not included in the solution
(because the inequality sign is a < or a > without the equal part),
the line is drawn as a dashed line, to show it is not part of the solution.
To draw the line, you just need two plot to points and connect them.
We could use
 --> -->  for point (-1,-1) and for point (-1,-1) and
 --> -->  for point (1,5). for point (1,5).
Here are my points (circled in blue) and my dashed line 
The solution is all the points with  less than the corresponding point (with the same less than the corresponding point (with the same  ) on the line. In other words, the solution is all the points below the line, which in this case means to the right of the line. ) on the line. In other words, the solution is all the points below the line, which in this case means to the right of the line.
There is an easier way to figure out what half of the x-y plane is the solution.
You pick a test point that is not on the line and makes calculations easy, and figure out if the test point is in the half of the plane that is the solution.
In this case, the origin (point (0,0), with  and and  ) works well. ) works well.
For point (0,0),  , so the origin is part of the solution, , so the origin is part of the solution,
and the half of the x-y plane containing the origin should be colored or shaded.
The end colored graph looks like this:
|
|
|