Question 695850: Let E(x) = 30(1.05)^x and L(x) = 30 + 2x.
I need to give an example of a value x when L(x) < E(x). Can someone please help? I am really struggling with this one. I have the rest of the problem figured out.
Answer by KMST(5328)   (Show Source): (Show Source):
You can put this solution on YOUR website!  is a cleverly named is a cleverly named  inear function, while inear function, while
 is a cleverly named is a cleverly named  xponential function. xponential function.
Linear functions graph as straight lines, and represents a line with a slope of  throughout its all real numbers domain. throughout its all real numbers domain.
Exponential functions graph as curved lines, and if the base is greater than one, as for , have "exponential growth" graphs that look like this 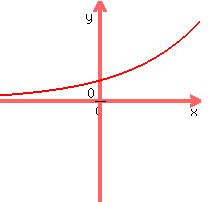 , with slopes that increase from very small to very large. , with slopes that increase from very small to very large.
The line could be tangent to the exponential curve and the graphs could intersect at only one point, as in 
Otherwise, a linear curve and an exponential curve could intersect at two points  , or zero points , or zero points  . .
In any of those cases, the line is below the exponential curve ( ) at most (if not all) points, for most (if not all) values of ) at most (if not all) points, for most (if not all) values of  . .
Which of those scenarios is the case for your functions?
 and and
 , so the graphs intersect at a least one point, with , so the graphs intersect at a least one point, with  . .
We can look at points to either side.
If the curves are tangent at , for all other values of
it will be (.
If the curves are not tangent at , then they intersect at two points,
In that case,  will be true at least in some interval to one side of , and we may be lucky enough to find a point there. will be true at least in some interval to one side of , and we may be lucky enough to find a point there.
For  : :
 and and
 so for , so for , 
For  : :
 and and
 =approx. =approx. so for so for  , ,
|
|
|