 We graph the three boundary lines, and we draw them all as
dotted lines because the inequalities are < and > and not
≦ and ≧.
We graph the three boundary lines, and we draw them all as
dotted lines because the inequalities are < and > and not
≦ and ≧.

 We use the origin (0,0) as a test point,
Substituting x=0, y=0 in each gives:
We use the origin (0,0) as a test point,
Substituting x=0, y=0 in each gives:
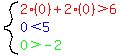 The red inequality is false, so the region to shade is above and
to the right of the red dotted line, because (0,0) is NOT on that
side of the red line.
The blue inequality is true, so the region to shade is to the left
of the blue line, because (0,0) IS on that side of the blue line.
The green inequality is true, so the region to shade is above
the green line, because (0,0) IS on that side of the green line.
Therefore the region to shade is
The red inequality is false, so the region to shade is above and
to the right of the red dotted line, because (0,0) is NOT on that
side of the red line.
The blue inequality is true, so the region to shade is to the left
of the blue line, because (0,0) IS on that side of the blue line.
The green inequality is true, so the region to shade is above
the green line, because (0,0) IS on that side of the green line.
Therefore the region to shade is
 Edwin
Edwin

