Question 65647: we have graphed the boundary line for the linear inequality. Determine the correct half-plane in each case, and complete the graph.
Y > 3
THE GRAPH THAT IS ON THE BOOK ITS A LINE JUST GOING THROUGH ALL 3 ON THE TOP TWO THE NEGATIVE SIDE AND POSITIVE SIDE LIKE THIS:
<----------3------------------>
i DON'T KNOW HOW TO ANSWER THIS AND I DON'T EVEN UNDERSTAND WHAT IS ASKING
Found 2 solutions by funmath, Edwin McCravy:
Answer by funmath(2933)   (Show Source): (Show Source):
You can put this solution on YOUR website! we have graphed the boundary line for the linear inequality. Determine the correct half-plane in each case, and complete the graph.
Y > 3
THE GRAPH THAT IS ON THE BOOK ITS A LINE JUST GOING THROUGH ALL 3 ON THE TOP TWO THE NEGATIVE SIDE AND POSITIVE SIDE LIKE THIS:
<----------3------------------>
They want you to shade above the line. We don't have the capability of shading in the graphing program (at least not that I know of), but the graph y=3 looks like this:
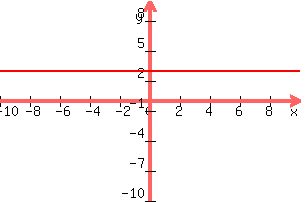
The difference between this and y>3 is that the line should be dashed, and you shade the area above the line indicating y is greater than 3, but not equal to 3.
Hope that helps.
Happy Calculating!!!
Answer by Edwin McCravy(20056)  (Show Source): (Show Source):
You can put this solution on YOUR website! we have graphed the boundary line for the linear inequality. Determine the
correct half-plane in each case, and complete the graph.
Y > 3
THE GRAPH THAT IS ON THE BOOK ITS A LINE JUST GOING THROUGH ALL 3 ON THE TOP
TWO THE NEGATIVE SIDE AND POSITIVE SIDE LIKE THIS:
<----------3------------------>
i DON'T KNOW HOW TO ANSWER THIS AND I DON'T EVEN UNDERSTAND WHAT IS ASKING
A "half-plane" is all the area on just one side of a line.
The boundary line for the INEQUALITY
y > 3
has the EQUATION
y = 3
To draw the graph of y = 3, plot some points. Since there is only
one letter in y = 3, we must choose the y-value of every point to
be 3, but since there is no x, you can choose x to be any number.
I'll arbitrarily pick 3, -2, 5, and -4 for x, and only 3 for y.
x|y
-----
3|3
-2|3
5|3
-4|3
So plot these points (3,3), (-3,3), (5,3), and (-4,3)
They all line on this horizontal line:
 That horizontal line should be drawn dotted, not solid
as I have here, but I can only draw solid lines on here,
but you can draw it dotted on your paper. (If the
inequality symbol is > or <, then you draw the boundary
line dotted. If the inequality symbol is > or
<, you draw the boundary line solid.
If the inequality starts off " y > " or " y > "
you shade the area ABOVE the line.
If the inequality starts off " y < " or " y < "
you shade the area BELOW the line.
Your inequality starts off " y > ", so you shade the
area ABOVE the line, like where these slanted lines are
That horizontal line should be drawn dotted, not solid
as I have here, but I can only draw solid lines on here,
but you can draw it dotted on your paper. (If the
inequality symbol is > or <, then you draw the boundary
line dotted. If the inequality symbol is > or
<, you draw the boundary line solid.
If the inequality starts off " y > " or " y > "
you shade the area ABOVE the line.
If the inequality starts off " y < " or " y < "
you shade the area BELOW the line.
Your inequality starts off " y > ", so you shade the
area ABOVE the line, like where these slanted lines are
 But don't forget to draw the horizontal line dotted instead of
solid as I have it here, and to shade the area ABOVE the line.
The area you shade is called a "half plane"
Edwin
But don't forget to draw the horizontal line dotted instead of
solid as I have it here, and to shade the area ABOVE the line.
The area you shade is called a "half plane"
Edwin
|
|
|