Question 65522: Graph each of the following equations.
(20) y = 3/4x+2
Graph each of the following equations, using the intercept method.
(28) 2x +3y = 6
Graph each of the following equations, by first solving for y.
(34) 2x-3y=12
Answer by funmath(2933)   (Show Source): (Show Source):
You can put this solution on YOUR website! Graph each of the following equations.
(20) y = 3/4x+2
This is in slope-intercept form:  , where m=slope and (0,b)=y-intercept. , where m=slope and (0,b)=y-intercept.
In this case (0,b)=(0,2) Plot (0,2), it's at 2 on the y-axis.
From that point, use your slope, m=3/4 to plot another point. Slope=rise/run, so rise 3 and run right 4. Plot another point there, it should be (4,5).
Connect the points and it should look like this:

:
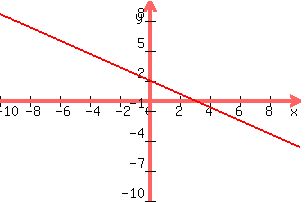
Graph each of the following equations, using the intercept method.
(28) 2x +3y = 6
To find the x-intercept, let y=0 and solve for x:
2x+3(0)=6
2x+0=6
2x=6
2x/2=6/2
x=3 Plot (3,0), it's at 3 on the x-axis.
To find the y-intercept, let x=0 and solve for y:
2(0)+3y=6
0+3y=6
3y=6
3y/3=6/3
y=2 Plot (0,2), it's at 2 on the y-axis.
Connect the points and you should have a line that looks like this:
:
Graph each of the following equations, by first solving for y.
(34) 2x-3y=12
-2x+2x-3y=-2x+12
0-3y=-2x+12
-3y=-2x+12
-3y/-3=-2x/-3+12/-3
y=(2/3)x-4
m=2/3 (0,b)=(0,-4)
Plot (0,-4), it's at -4 on the y-axis.
From there use the slope, m=2/3, rise 2, and run right 3 and plot a second point at what should be, (3,-2).
Connect the points and you should have a line that looks like this:

Happy Calculating!!!!
|
|
|