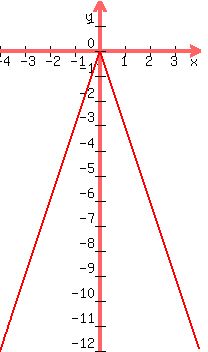
graph y= -|3x|

Get some points

x = -3
y = -|3(-3)| = -|-9| = -(+9) = -9
So one point is (-3,-9)

x = -2
y = -|3(-2)| = -|-6| = -(+6) = -6
So one point is (-2,-6)

x = -1
y = -|3(-1)| = -|-3| = -(+3) = -3
So one point is (-1,-3)

x = 0
y = -|3(0)| = -|0| = -(0) = 0
So one point is (0,0)

x = 1
y = -|3(1)| = -|3| = -(+3) = -3
So one point is (1,-3)

x = 2
y = -|3(2)| = -|6| = -(+6) = -6
So one point is (2,-6)

x = 3
y = -|3(3)| = -|9| = -(+9) = -9
So one point is (3,-9)

Plot those points, connect them and you
have this graph:


Edwin
Edwin

