Question 64826: If f(x) = 2x, describe the transformation of the curve for g(x) = -2 x-2
I desparetely need help with this thank you
Answer by mszlmb(115)   (Show Source): (Show Source):
You can put this solution on YOUR website! "If f(x) = 2x, describe the transformation of the curve for g(x) = -2 x-2
I desparetely need help with this thank you"
I assume you mean the line rather than the 'curve,' as both f(x) and g(x) are linear. For the record, here is a graph of both:
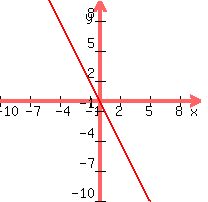
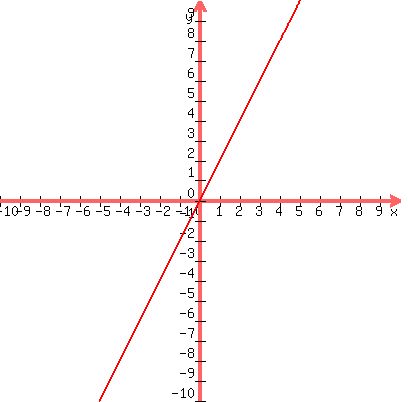
F(x)=2x
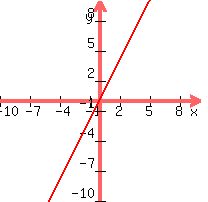
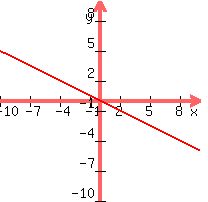
G(x)=-2x-2

What the question is basically asking is 'How does G differ from F?'
To get from F to G, first we make the "2x" negative. What happens when you make something negative? They are 'flipped' along the horizontal axis. Here are some examples:
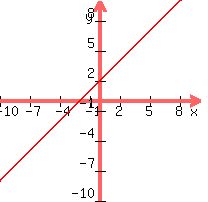
Graph of F(x)=x
Graph of F(x)=-x
See how they're flipped along the horizontal (x) axis? Let's look at another:
Graph of F(x)=x/2
Graph of F(x)=-x/2
So, the graph of -2x in regard to 2x, is flipped;
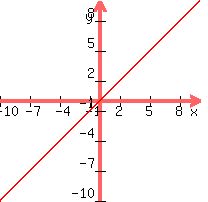
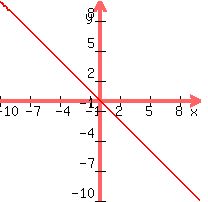
Graph of F(x)=2x
Graph of F(x)=-2x
But then we subtract two, what does that do to the graph?? Here are some examples to help verify. Adding or subtracting to a linear equation (an equation in the form of y=mx+b) moves it along the vertical (y) axis:
Graph of F(x)=x
Graph of F(x)=x+2
You know, let's have some fun with this. Following is a graph of the function Y=X+1, y=x+2, y=x+3, etc., and y=x+0, y=x-1, y=x-2, etc. Just to illustrate the point; these are all on the same graph: [EDIT: Upon reviewing, I found that many of the lines are white. They're plotted, but they're white. They'll look like cutouts of the x and y axes.]

Pretty cool, huh? You see, adding any amount to x moves it up that amount, and subtracting an amount from x moves it down that amount. Therefore, the difference between f(x)=2x and g(x)=2x-2 is that G(x) moves down two. Notice I didn't include g(x)=-2x-2.
Well, making it negative flips it along the x axis (horizontally), and subtracting 2 from it moves it down two units. Thus, the transformation is the line is flipped along the x axis and moved two units down.
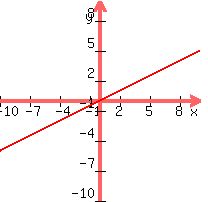
Here are the anticipated graphs:
F(x)=2x
G(x)=-2x-2
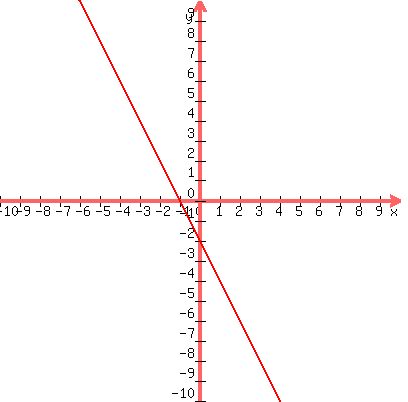
You'll notice that G(x) is simply F(x)'s function flipped along the x axis and moved down 2. It's as simple as that! Any questions, feel free to ask.
|
|
|