SOLUTION: scores on a standardized test are normally distributed with a mean of 550 and standard deviation of 140. convert to a Z-score and use a table to find the following:
the percenta
Algebra ->
Probability-and-statistics
-> SOLUTION: scores on a standardized test are normally distributed with a mean of 550 and standard deviation of 140. convert to a Z-score and use a table to find the following:
the percenta
Log On
Question 632326: scores on a standardized test are normally distributed with a mean of 550 and standard deviation of 140. convert to a Z-score and use a table to find the following:
the percentage of students who score below 655
the percentage of students who score above 746 Answer by Theo(13342) (Show Source):
You can put this solution on YOUR website! mean = 550
standard deviation = 140
z-score = (data - mean) / standard deviation
z-score-1 = (655 - 550) / 140 = .75
z-score-2 = (746 - 550) / 140 = 1.4
look in the z-score table to find a z-score of .75 and a z-score of 1.4
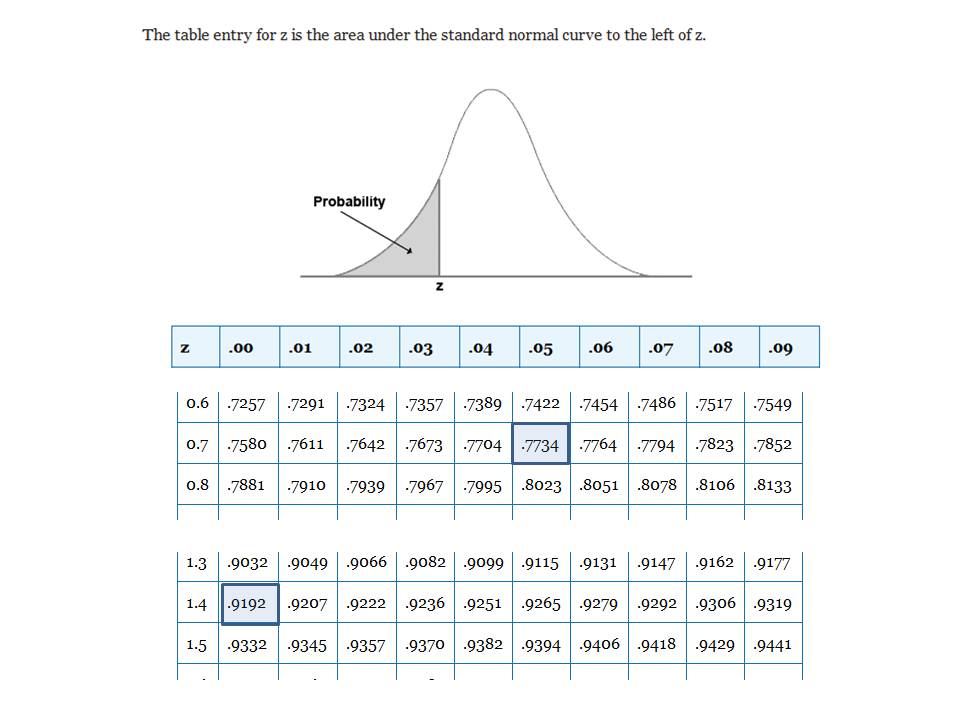
the percentage of students who score below 655 is equal to the area to the left of the z-score which is equal to .7734 * 100% = 77.34%
the percentage of students who score above 746 is equal to the area to the right of the z-score which is equal to 1 minus .9192 which is equal to .0805 * 100% = 8.05%
the z-score table used is shown below:
a comparable z-score table can be found at the following link: http://lilt.ilstu.edu/dasacke/eco148/ztable.htm
An Example of find a z-score.
To find the z-score of .75, you scan down the left column until you find 0.7 and you scan to the right of the top column until you find 0.05.
The combination of 0.7 and 0.05 gets you 0.75 when you add them together.
The cell that intersects with the row that 0.7 is on and the column that 0.05 is on is the cell that contains the area to the left of that z-score.
In this particular case, that cell contained .7734.
This procedure is applicable to the table that I used and also to the table that I gave you the link from.
Not all table work the same way, so you need to make sure that you understand the table procedure before you ue it.
A link to a tutorial on how to use z-score distribution tables is shown below: http://www.algebra.com/algebra/homework/Probability-and-statistics/change-this-name28108.lesson