Question 62974: A small company produces both doll houses and sets of doll furniture. The doll houses take 3 hours of labor to produce, and the furniture sets take 8 hours. The labor available is limited to 400 hours per week, and the total production capacity is 100 items per week. Existing orders requare that at least 20 doll houses and 10 sets of furniture be produced per week. Write a system of inequalities representing this situation, where x is the number of doll houses and y is the number of furniture sets. Then graph the system of inequalities.
Answer by Edwin McCravy(20056)   (Show Source): (Show Source):
You can put this solution on YOUR website! A small company produces both doll houses and sets of doll furniture. The
doll houses take 3 hours of labor to produce, and the furniture sets take 8
hours. The labor available is limited to 400 hours per week, and the total
production capacity is 100 items per week. Existing orders requare that at
least 20 doll houses and 10 sets of furniture be produced per week. Write a
system of inequalities representing this situation, where x is the number of
doll houses and y is the number of furniture sets. Then graph the system of
inequalities.
First we construct the labor hours inequality:
At 3 hours of labor for each of the x doll
houses amounts to 3x hours of labor to make the
x doll houses
At 8 hours of labor for each of the y furniture
sets amounts to 8y hours of labor to make the y
furniture sets.
So the total amount of labor is the sum of those,
or 3x + 8y hours of labor
We are told that we are limited to 400 hours of
labor so we write the labor hours inequality:
3x + 8y < 400
Next we construct the items inequality:
The x doll houses amounts to x items per week
The y furniture sets amounts to y items per
week.
So the total amount of items is the sum of
those, or x + y items
We are told that we are limited to 100 items
per week so we write the item inequality:
x + y < 100
Next we construct the doll house inequality:
We are told that we must make at least 20 doll
houses per week, so we write the doll house
inequality:
x > 20
Next we construct the furniture set inequality:
We are told that we must make at least 10
furniture sets per week, so we write the
furniture set inequality:
y > 10
Now there are two obvious inequalities which
tell us that the number of doll houses and the
number of furniture sets must not be a negative
number, so they are these:
x > 0
y > 0
So the six inequalities are
3x + 8y < 400
x + y < 100
x > 20
y > 10
x > 0
y > 0
We draw the boundary lines, which are
formed by replacing the inequality
symbols by = signs, so we have these
four boundary lines, and their intercepts:
3x + 8y = 400 (0,50), (33.3,0)
x + y = 100 (0,100), (100,0)
x = 20 (20,0) vertical line
y = 10 (0,10) horizontal line
x = 0 y-axis
y = 0 x-axis
Since x and y are non-negative we draw only the upper
right quadrant, right of the y axis and above the x-axis:
Drawing the first boundary line in red:
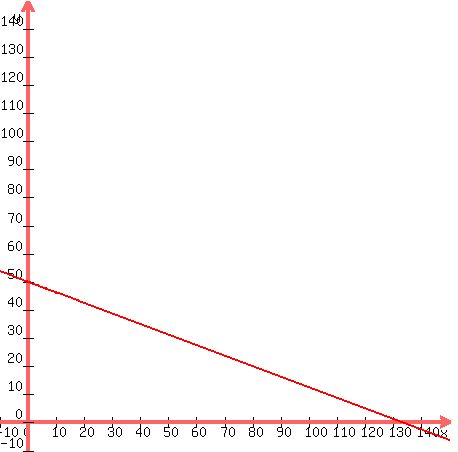 Now since the origin (0,0) when substituted into the
inequality 3x + 8y < 400 gives a true result
0 < 400 the graph is underneath this line because
that is the side of that line that the origin is on.
Now we draw the second boundary line in green:
Now since the origin (0,0) when substituted into the
inequality 3x + 8y < 400 gives a true result
0 < 400 the graph is underneath this line because
that is the side of that line that the origin is on.
Now we draw the second boundary line in green:
 Now since the origin (0,0) when substituted into the
inequality x + y < 100 gives a true result
0 < 100 the graph is underneath this line because
that is the side of that line that the origin is on.
Now we draw the third boundary line in blue:
Now since the origin (0,0) when substituted into the
inequality x + y < 100 gives a true result
0 < 100 the graph is underneath this line because
that is the side of that line that the origin is on.
Now we draw the third boundary line in blue:
 Now since the origin (0,0) when substituted into the
inequality x < 20 gives a FALSE result
0 > 20 the graph is to the right of this blue
vertical line because that is the side the origin is
NOT on.
Now we draw the fourth boundary line in purple:
Now since the origin (0,0) when substituted into the
inequality x < 20 gives a FALSE result
0 > 20 the graph is to the right of this blue
vertical line because that is the side the origin is
NOT on.
Now we draw the fourth boundary line in purple:
 Now since the origin (0,0) when substituted into the
inequality y > 10 gives a FALSE result
0 > 10 the graph is above this purple
horizontal line because that is the side the
origin is NOT on.
We do not have to graph the last two boundary lines,
because they are the two axes, and we know that the
region to shade is always above the x-axis and to the
right of the y-axis.
So the area to be shaded is the region which is:
1. below the red slanted line
2. below the green slanted line
3. right of the blue vertical line
4. above the purple horizontal line
I can't shade that region on here, but you can on your
paper. It's the 4-sided figure whose top side is red,
bottom side purple, left side blue, and right side
green.
Edwin
Now since the origin (0,0) when substituted into the
inequality y > 10 gives a FALSE result
0 > 10 the graph is above this purple
horizontal line because that is the side the
origin is NOT on.
We do not have to graph the last two boundary lines,
because they are the two axes, and we know that the
region to shade is always above the x-axis and to the
right of the y-axis.
So the area to be shaded is the region which is:
1. below the red slanted line
2. below the green slanted line
3. right of the blue vertical line
4. above the purple horizontal line
I can't shade that region on here, but you can on your
paper. It's the 4-sided figure whose top side is red,
bottom side purple, left side blue, and right side
green.
Edwin
|
|
|