Question 619268: How do i graph the Asymptote ?
y = 1/x = -3
Answer by Theo(13342)   (Show Source): (Show Source):
You can put this solution on YOUR website! not sure what your equation is.
could be:
y = (1/x) - 3)
or could be:
y = (1/(x-3)
i'll assume y = 1/(x-3)
this will have a vertical asymptote at x = 3.
that's when the denominator goes to 0.
when x is smaller than 3, the graph will be negative
when x is larger than 3, the graph will be positive.
when x is smaller than 3, it will become more and more negative as you get closer to 3.
when x is larger than 3, it will become more and more positive, the closer you get to 3.
the graph will look like this:
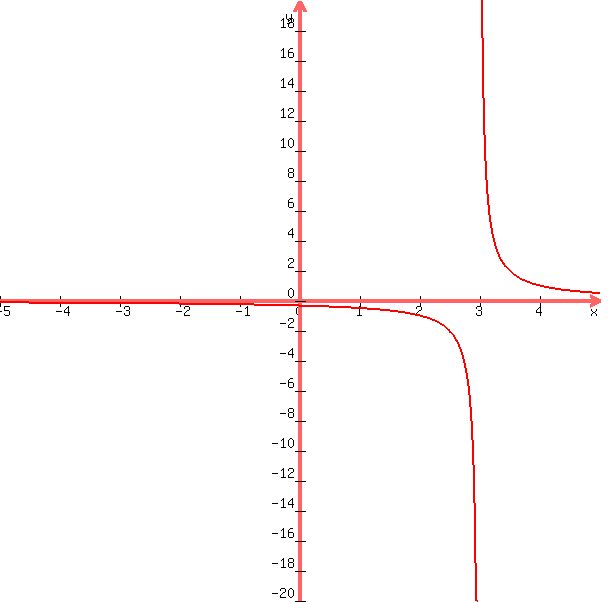
if you were to draw a vertical line at x = 3, you would see that each asymptote approaches that vertical line but never quite touches it.
the following graph simulates that as best i can do with algebra.com graphing software.

if you were to manually plot the graph, you would pick values of x that have less and less intervals between them the closer you get to 3.
something like:
values of x for:
2, 2.5, 2.8, 2.9, 2.95, 2.98, 2.99, 2.995, etc.
coming from the other end, you would have values such as:
3.005, 3.01, 3.02, 3.05, 3.1, 3.2, 3.5, 4
the graph will rise dramatically in either positive or negative direction the closser you get to x = 3.
|
|
|