Question 58455: Here is a function that I have been dealing with at work:
Y(x) = –3.3x2 + 0.5x + 300.
I need to use this function to tell researchers what value of x produces the maximum output signal for an MRI machine, Y. Also, since everyone’s MRI machine is not exactly the same as mine, I want to give them a range of x values that will produce nearly the maximum output Y. So, here are the questions:
1. What is the x value when Y is at its maximum value?
2. What is the maximum value of Y?
3. Since negative Y values are impossible for operating the MRI machine, what is the range of x values for Y to be greater than or equal to zero?
4. What is the range of x values where Y is at 90% of its maximum value?
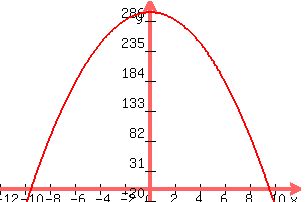
5. Plot Graph showing all of the above information.
Answer by stanbon(75887)   (Show Source): (Show Source):
You can put this solution on YOUR website! Y(x) = –3.3x2 + 0.5x + 300.
I need to use this function to tell researchers what value of x produces the maximum output signal for an MRI machine, Y. Also, since everyone’s MRI machine is not exactly the same as mine, I want to give them a range of x values that will produce nearly the maximum output Y. So, here are the questions:
1. What is the x value when Y is at its maximum value?
x=-b/2a = -0.5/-6.6=0.0757575...
2. What is the maximum value of Y? 300.02
3. Since negative Y values are impossible for operating the MRI machine, what is the range of x values for Y to be greater than or equal to zero?
-9.459169<=x<=9.61068
4. What is the range of x values where Y is at 90% of its maximum value?
0.9*300.02=279.018; -2.43424<=x<=2.5842
5. Plot Graph showing all of the above information.
Cheers,
Stan H.
|
|
|