|
Question 57629: Can someone help me draw this graph since I have to put it through the computer and not on paper?
I need to do a straight-line graph.
We start with a birthday gift check of $500 where we put in the bank as the first deposit and then add every month pocket money of $100 per month to it. My balance B as a function of months elaspsed will be B= 500 + 100*N=1
after 2 months N=2. B=500 + 2*100=700, etc
If you plot N on the x axis starting from N=0 to say 12 months and Bon Y axis it will be a straight line.
Could you draw the graph and show me the equation and how it would look.
I am lost.
Thanks, Sher
Found 2 solutions by phillv, funmath:
Answer by phillv(13)   (Show Source): (Show Source):
You can put this solution on YOUR website! Rewrite the equation in the forme of equation for a line:
Y=mX+b where m is the slope or stepeness of the line.
A positive slope indicates that the line will slant up and to the right.
Y=100X+500
Find the Y intercept by setting x=0
When X=0, Y=500
The Y intercept is Y=500
Find X intercept when Y=0
When Y=0, 0=100X+500
-500=100X, X=-500/100, X=-5
When Y=0, X=-5
The X intercept is X=-5
We now know that (0,500)and (-5,0)
are two points of this line.
Plot the two points and draw the line.
Answer by funmath(2933) (Show Source): (Show Source):
You can put this solution on YOUR website! Hi Sher, here's the graph that you asked for:
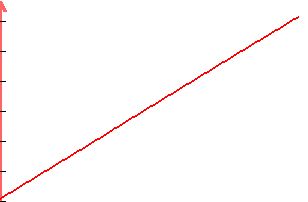
The horizontal axis (the x-axis) should be labeled 0 to 12.
The vertical axis (y-axis) should be labeld 490 to 1800.
Happy Calculating, Sher!!!
|
|
|
| |