SOLUTION: In this problem:
In a certain microwave oven on the high power setting, the time it takes a randomly chosen kernel of popcorn to pop is normally distributed with the MEAN of 150
Algebra ->
Probability-and-statistics
-> SOLUTION: In this problem:
In a certain microwave oven on the high power setting, the time it takes a randomly chosen kernel of popcorn to pop is normally distributed with the MEAN of 150
Log On
Question 557101: In this problem:
In a certain microwave oven on the high power setting, the time it takes a randomly chosen kernel of popcorn to pop is normally distributed with the MEAN of 150 seconds and a standard deviation of 25 seconds. What percentage of the kernels will fail to pop if the popcorn is cooked for
a) 2 minutes = 120 seconds
z(120) = (120-150)/25 =-30/25 = -6/5 = -1.2
P(z>-1.2) = 0.8849
I do understand how -1.2 was achieved but I do not understand how the final answer "0.8849 was achieved. Can you help me with that part? Thanks. Answer by Theo(13342) (Show Source):
You can put this solution on YOUR website! -1.2 is the z-score.
you now have to look in the z chart for a z-score of -1.2 to find the area under the curve that applies to that z-score.
most charts will give you the area of the normal distribution curves that is to the left of that z-score.
there are 2 basic different types of charts (more actually, but 2 are the most commonly used) so you have to be careful that you are reading the table the way it is supposed to be read.
both types of charts have their advantages and disadvantages.
pick the type of chart that you are most comfortable with.
a chart that i would recommend would be one that is in the following link. http://lilt.ilstu.edu/dasacke/eco148/ztable.htm
in this chart, you locate the z-score and then find the corresponding field that will tell you the area of the normal distribution curve that is to the left of that z-score.
that area will be the area for all z-scores less than the z-score you found.
to find the area to the right of that z-score, you would then calculate 1 minus that area.
let's see what happens when we look up your z-score.
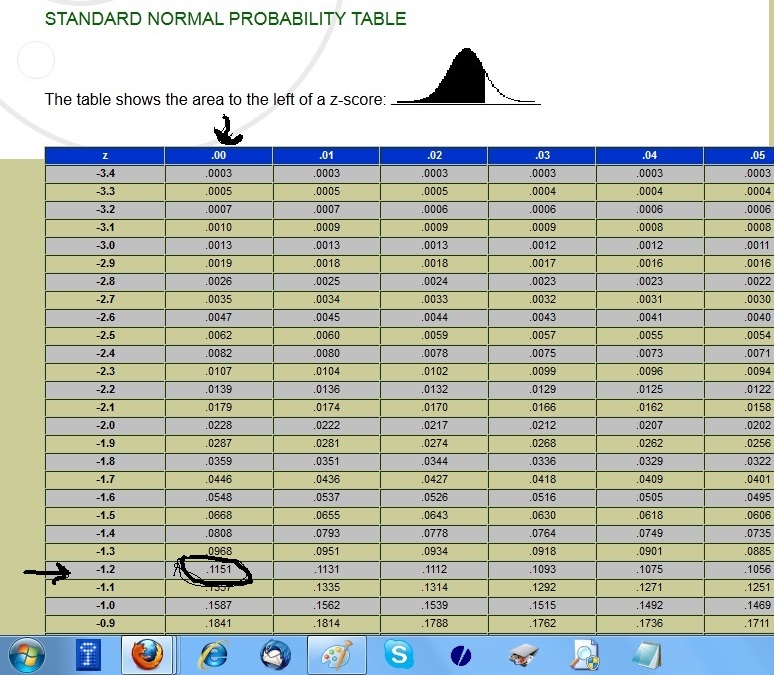
the following picture shows where your z-score is located in that table.
you will see that the entry for a z-score of -1.20 is equal to .1151.
that's the area in the normal distribution curve that is to the left of a z-score of -1.2.
to find the area to the right of that z-score, you would take 1 minus .1151 which would give you .8849.
that's the area to the right of a z-score of -1.2.
that tells you the probability that corn will pop after 120 seconds have elapsed.
.1151 of the corn will pop in less than 120 seconds.
.8849 of the corn will pop in greater than 120 seconds.
if you only cook the corn for 120 seconds, than that .8849 represents the corn that will not have popped.