Question 554415: Sorry i'm not sure if this is the right category for this question but its for year 12 specialist maths and is on reciprocal circular functions.
the question is sketch the graph of each of the following reciprocal circular function over the given domain
 , , the < are supposed to be greater than or equal to signs the < are supposed to be greater than or equal to signs
i'm not quite sure how to find the dilation factor for one and for two i know that the period is 2pie/b but is b 1 or is it pie/2??
Found 2 solutions by Theo, ikleyn:
Answer by Theo(13342)   (Show Source): (Show Source):
You can put this solution on YOUR website! not sure if i know the answer to this, but, in general, the formula for a repeating trigonometric function is:
y = a(b(x-c)+d
a is the amplitude.
b is the frequency
c is the horizontal displacement
d is the vertical displacement.
the function you are describing looks like the reciprocal of the cosine function.
as a cosine function, the formula would be:
y = cos(x-pi/2)
the frequency is 1
the horizontal displacement is pi/2
what this means is:
when x = 0, you are taking the cosine of (-pi/2)
when x = pi/2, you are taking the cosine of 0
etc.
the graph that peaks at x = 0 is the cosine(x) graph.
the graph that peaks at x = pi/2 is the cosine(x-pi/2) graph.
this is because:
when x = 0, cosine(x) = cosine(0) = 1
and:
when x = pi/2, cosine(x-pi/2) = cosine(0) = 1
the graph of y = sec(x-pi/2) is the reciprocal of the graph of cos(x-pi/2)
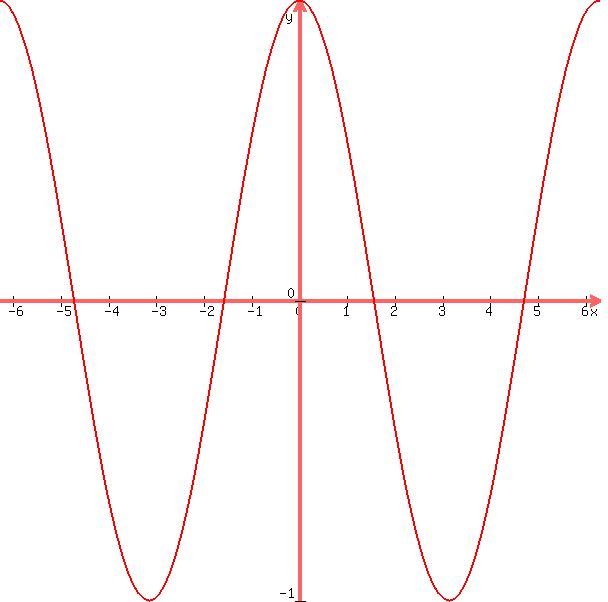
the graph of the cosine function of x would look like this:
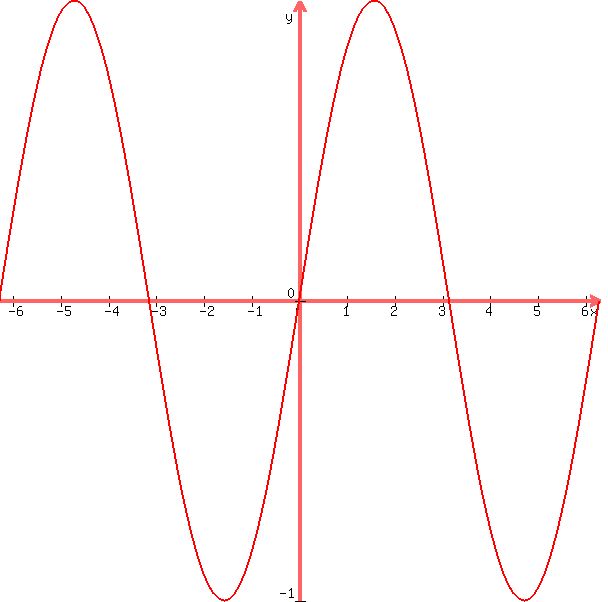
the graph of the cosine function of (x-pi/2) would look like this:
if you superimpose the second graph on the first, you will see that there is a shift of pi/2 as shown below:

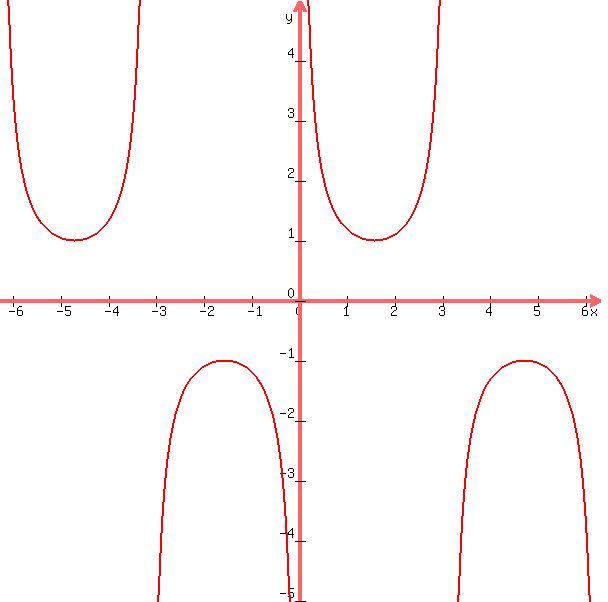
since sec(x) = 1/cos(x), this means that the graph of:
y = sec(x-pi/2) can be graphed as:
y = 1/cos(x-pi/2)
that graph is shown below:
when you superimpose that graph on the graph of cos(x-pi/2) you get the following:

i'm not exactly sure what you mean by dilation factor.
i couldn't see where it would apply in this problem.
if you are talkin about a change in frequency which would result in a change in period, that doesn't apply to this problem as far as i can see.
Answer by ikleyn(52812)  (Show Source): (Show Source):
|
|
|