|
Question 51817This question is from textbook algebra 2 equations, graohs, and applicatiopns
: i have no idea how to graph a linear inequality, could you please help me solve this problem step by step!!
x+y> or equal to -2
-4x+y< or equal to -5
i dont know how to graph shade or plot the numbers could you please help me!!
thanks!!!
This question is from textbook algebra 2 equations, graohs, and applicatiopns
Answer by venugopalramana(3286)   (Show Source): (Show Source):
You can put this solution on YOUR website! see the following example and try
----------
2x+y>=2..................1
y
y>0............................3
step1.
first write them as eqns. and plot as a normal graph....
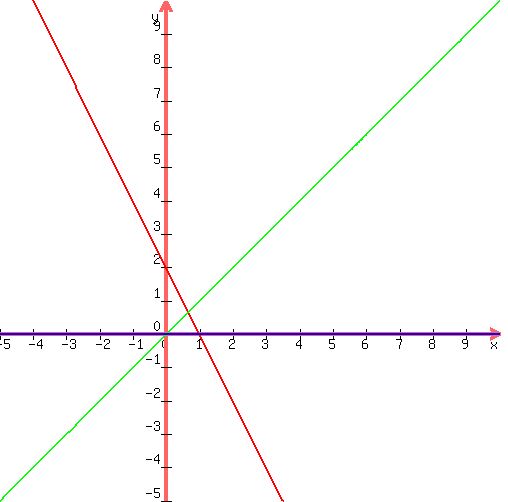
2x+y=2.....find points on the graph by taking any value for x and finding y from the given eqn.as shown below..
x..............0.................1........................2.....etc
y=2-2x......2.................0.......................-2......etc
plot the graph of this eqn.it will be a straight line with slope of -2,and intercept of 2.
y-x=0
x...........0................1....................2..........etc.
y=x........o................1....................2.........etc...
this graph is also a straight line through origin and slope of 1.
y=0
x.....................0............1..........................2..........etc
y=0.................0.............0..........................0........etc
this is also a straight line through origin ..in fact it is x axis.
step 2.
now detemine and shade / hatch the zone of required inequality..
in the first case we want 2x+y>=2...we plotted 2x+y=2..so we take origin and test for the inequality..origin is x=0,y=0
hence 2x+y=0+0=0 ..it is not greater than or equal to 2 .so the zone to be shaded is the area away from origin with the line considered as boundary,since area towards origin (as we have tested ) gives 2x+y<=0.so shade or hatch this area which you find is area above the line and includes the line as = is also allowed .
do same way for the other 2 eqns...
y-x < 0 ....here it is the area below the line,and excludes the line since = is not mentioned.
y>0.....here it is the area above x axis and excludes the line (x axis) since = is not mentioned.
the common area belonging to all the 3 in the shaded zones is the required answer.it is the area above x axis,below y=x line and above 2x+y=0 line.see graph below..
|
|
|
| |